
As any accountant knows, the practice of accounting is great for providing the state of things. According to the article, “The Purpose of Accounting: Why It Matters Now More Than Ever,” the purpose is “to accumulate and report on financial information about the performance, financial position, and cash flows of a business.” While accounting is useful for informing an organization about its past and present, the function also helps to answer questions like these:
- In what areas did we make money?
- How much did we spend on personnel?
- What was our net income?
Once these questions are answered, it is time to go to the next step and use that information to make business decisions (as previously mentioned, accounting helps you make decisions that affect the future).
In many organizations, accountants and stakeholders manually review financial reports to make decisions (often by exporting them to Excel and manipulating the data). They may also generate and design reports for management to analyze, which further assists with the decision-making process.
As technology continues to evolve, tools like the Solver xFP&A suite and its Copilot Analysis Agent are designed to support these efforts by helping users explore data more efficiently. The purpose of this article is to provide examples of how you can use technology to analyze data in financial reports and, perhaps, make or save money as a result.
Analyzing Data
Organizations often use multiple tools such as Excel, financial reporting applications, accounting systems, and data visualization tools like Power BI for analyzing data. The successful use of these tools, like any reporting platform, depends on someone taking a closer look at the data, understanding it, and using those insights to make more informed decisions. As part of the analysis process, professionals typically explore questions, such as:
- What if we sold more of X in region Y?
- What are the trends if sales go up or down by a percentage?
- What are our biggest expenses? And why?
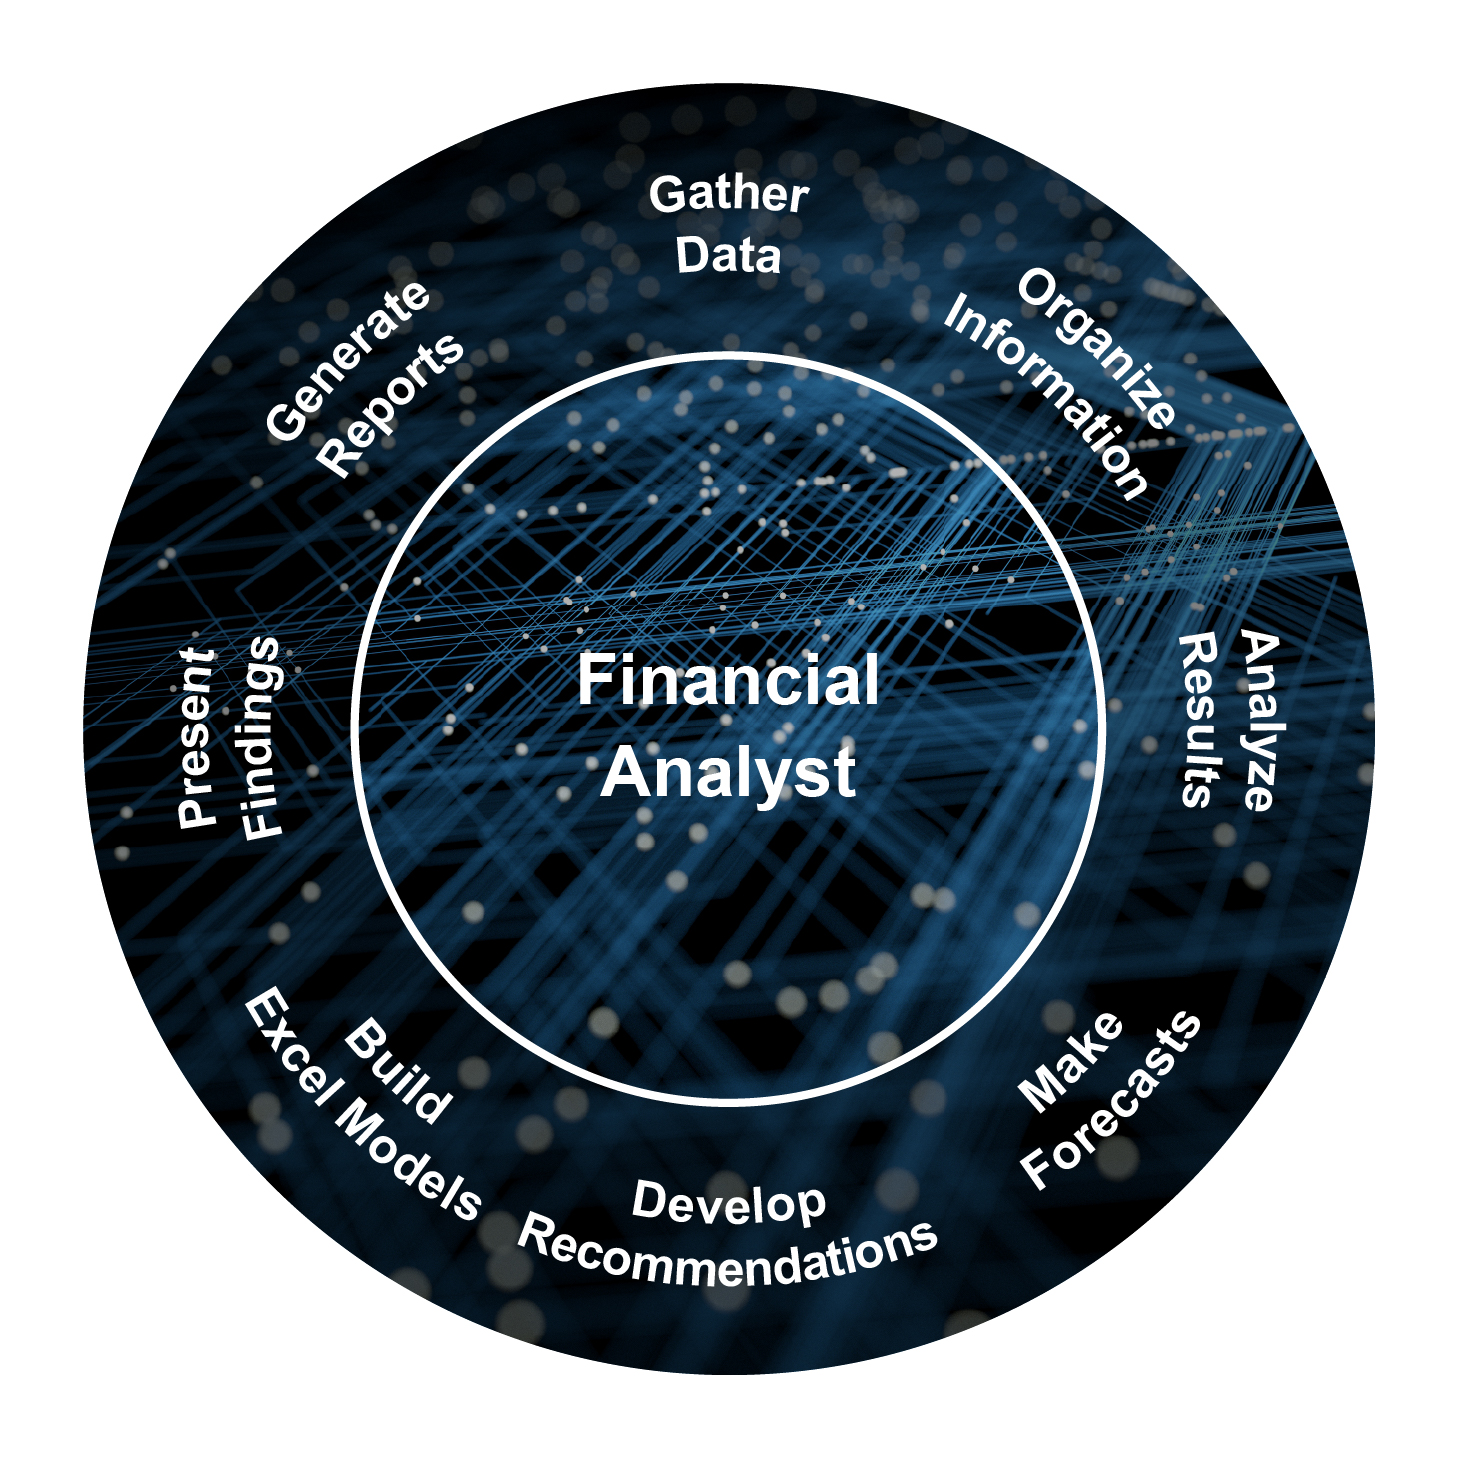
These questions are just three examples of the types of analysis that accountants and stakeholders should perform to better understand the story behind the numbers.
This graphic illustrates the role of the analyst in bringing clarity to this information.
The Solver xFP&A suite includes the Copilot Analysis Agent to support deeper analysis, help you ask questions, and answer them. Solver is a cloud-based reporting and planning solution. Besides providing users with the ability to create reports and plans, it provides them with the ability to ask questions and get answers. While Copilot may not give you direct answers on how to make more money, it can give you details about your business and financial information to help you find ways to do so.
The Copilot Analysis Agent can support a variety of requests, including:
- Asking questions and receiving answers related to a specific report
- Creating a narrative summary with indicators
- Performing trend analysis with charting
- Identifying outliers (anomalies)
- Performing variance analysis with top/bottom ranking
- Recommending additional reports or analysis
- Performing what-if analysis
- Creating popular key performance indicators (KPIs) from financial reports
- Prescribing suggested actions (prescriptive analytics)
- Benchmarking against public data and displaying in tables
- Conducting a root-cause analysis
- Finding correlations in data
- Recommending related reports
- Creating ad-hoc forecasts by performing a Monte Carlo analysis
Here are a few examples of how Solver Copilot can help you analyze your reports.
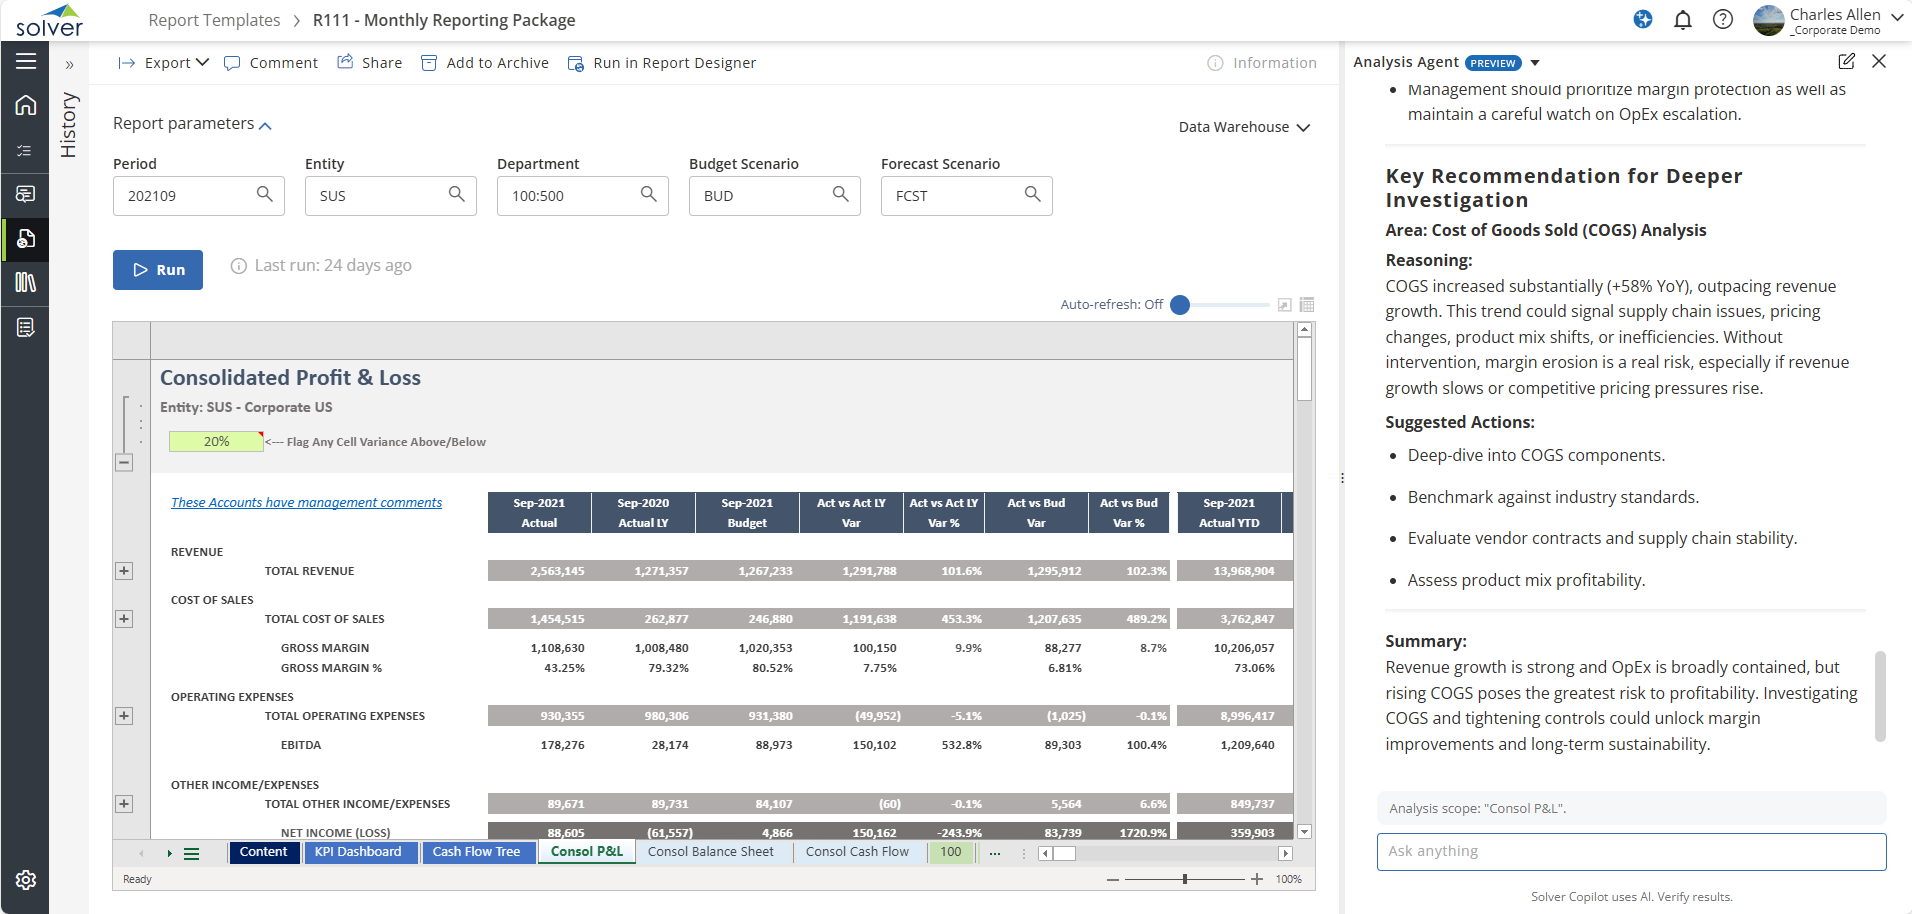
Identify key areas for deeper analysis.
 Click here to open in new tab.
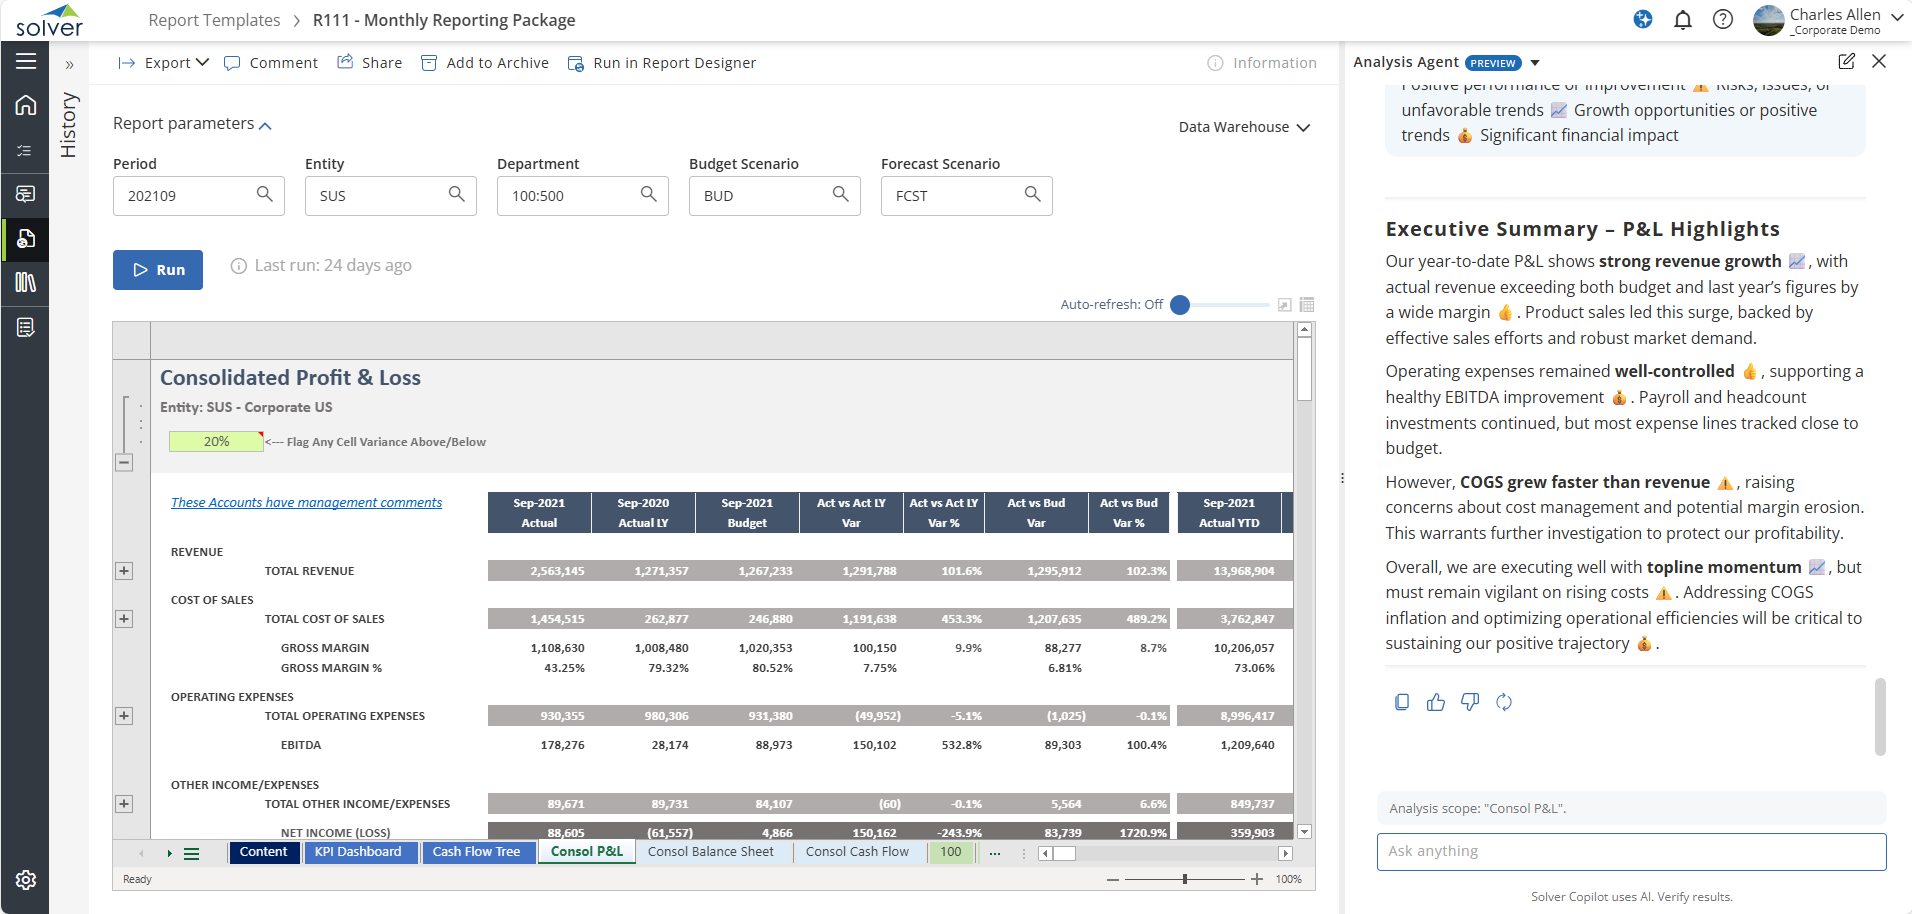
Generate a narrative summary with insights.
 Click here to open in new tab.
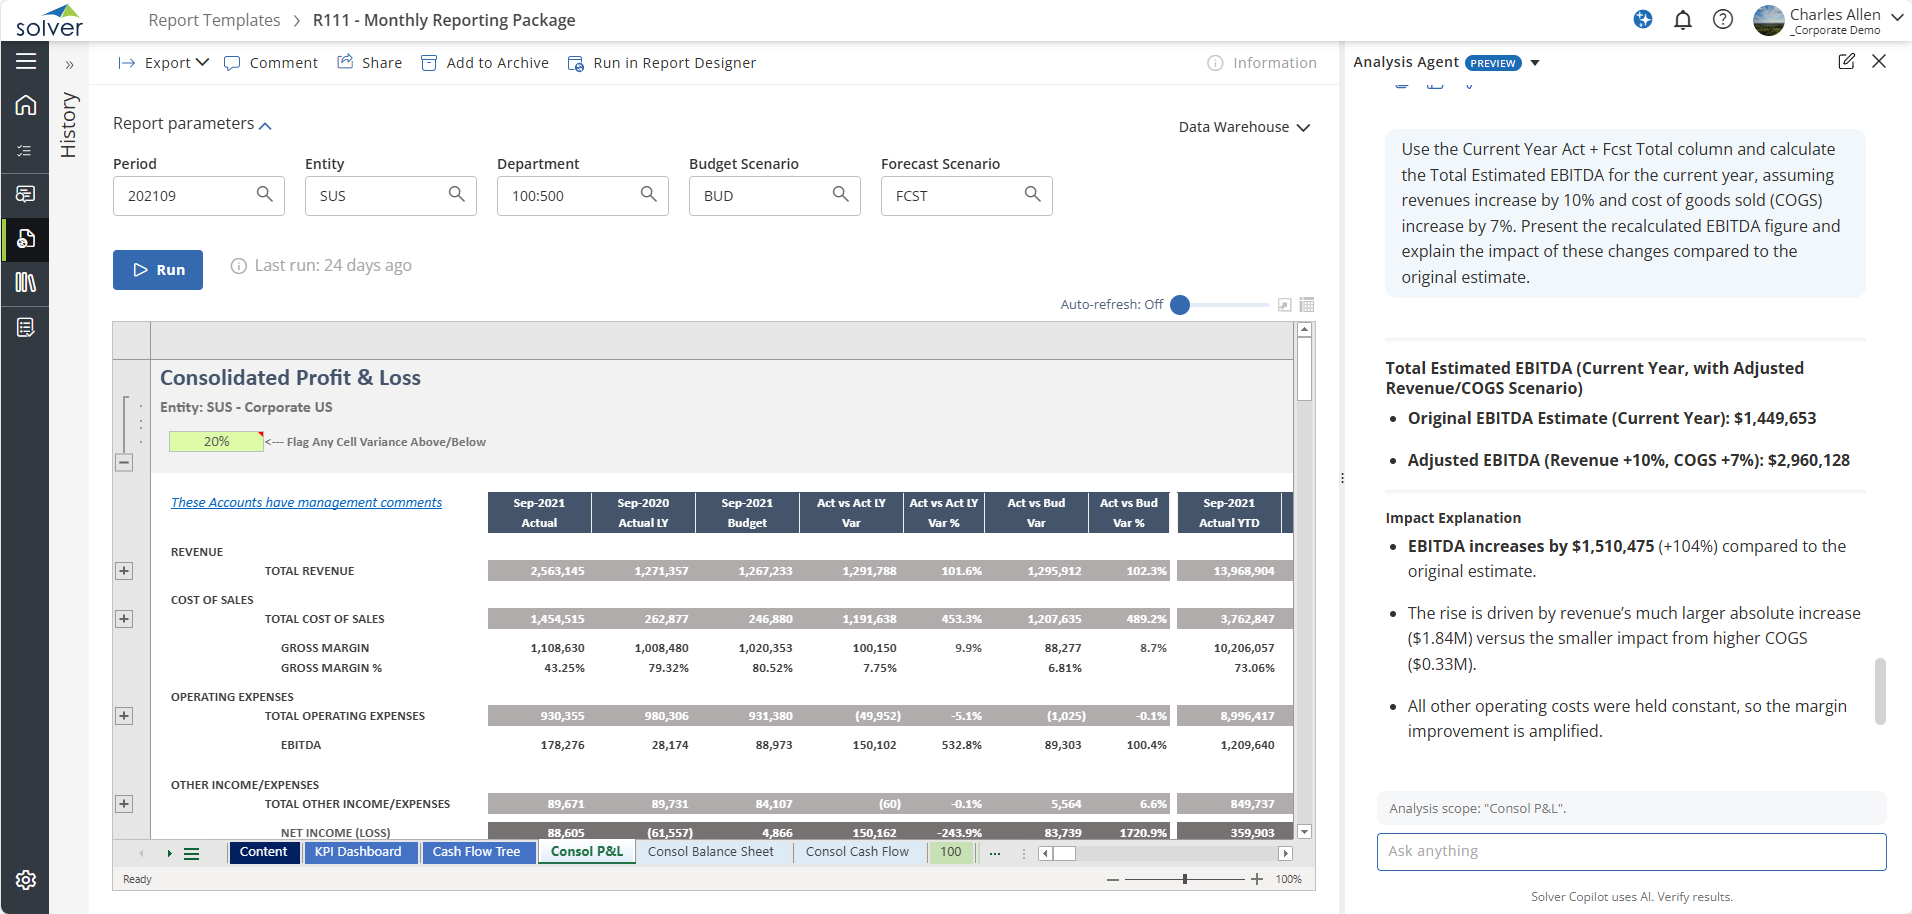
Perform a what-if analysis.
 Click here to open in new tab.
Perform prescriptive analytics.
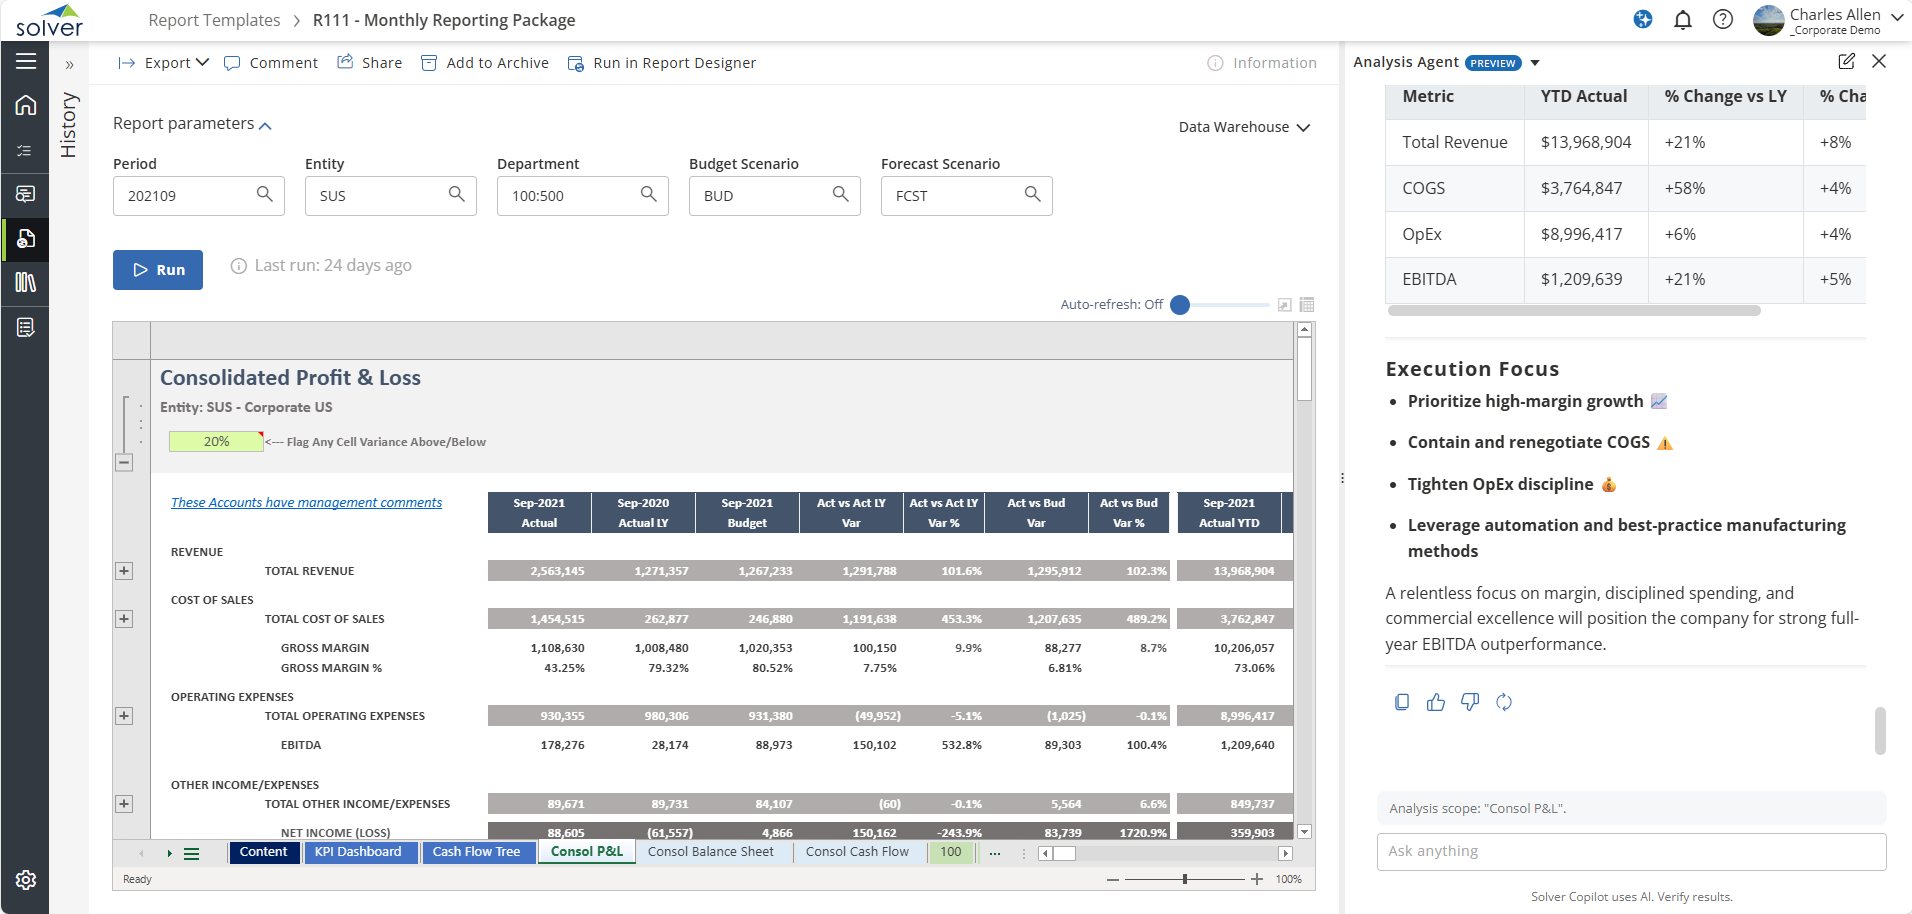 Click here to open in new tab.
Create an ad-hoc cash flow forecast by performing a Monte Carlo analysis.
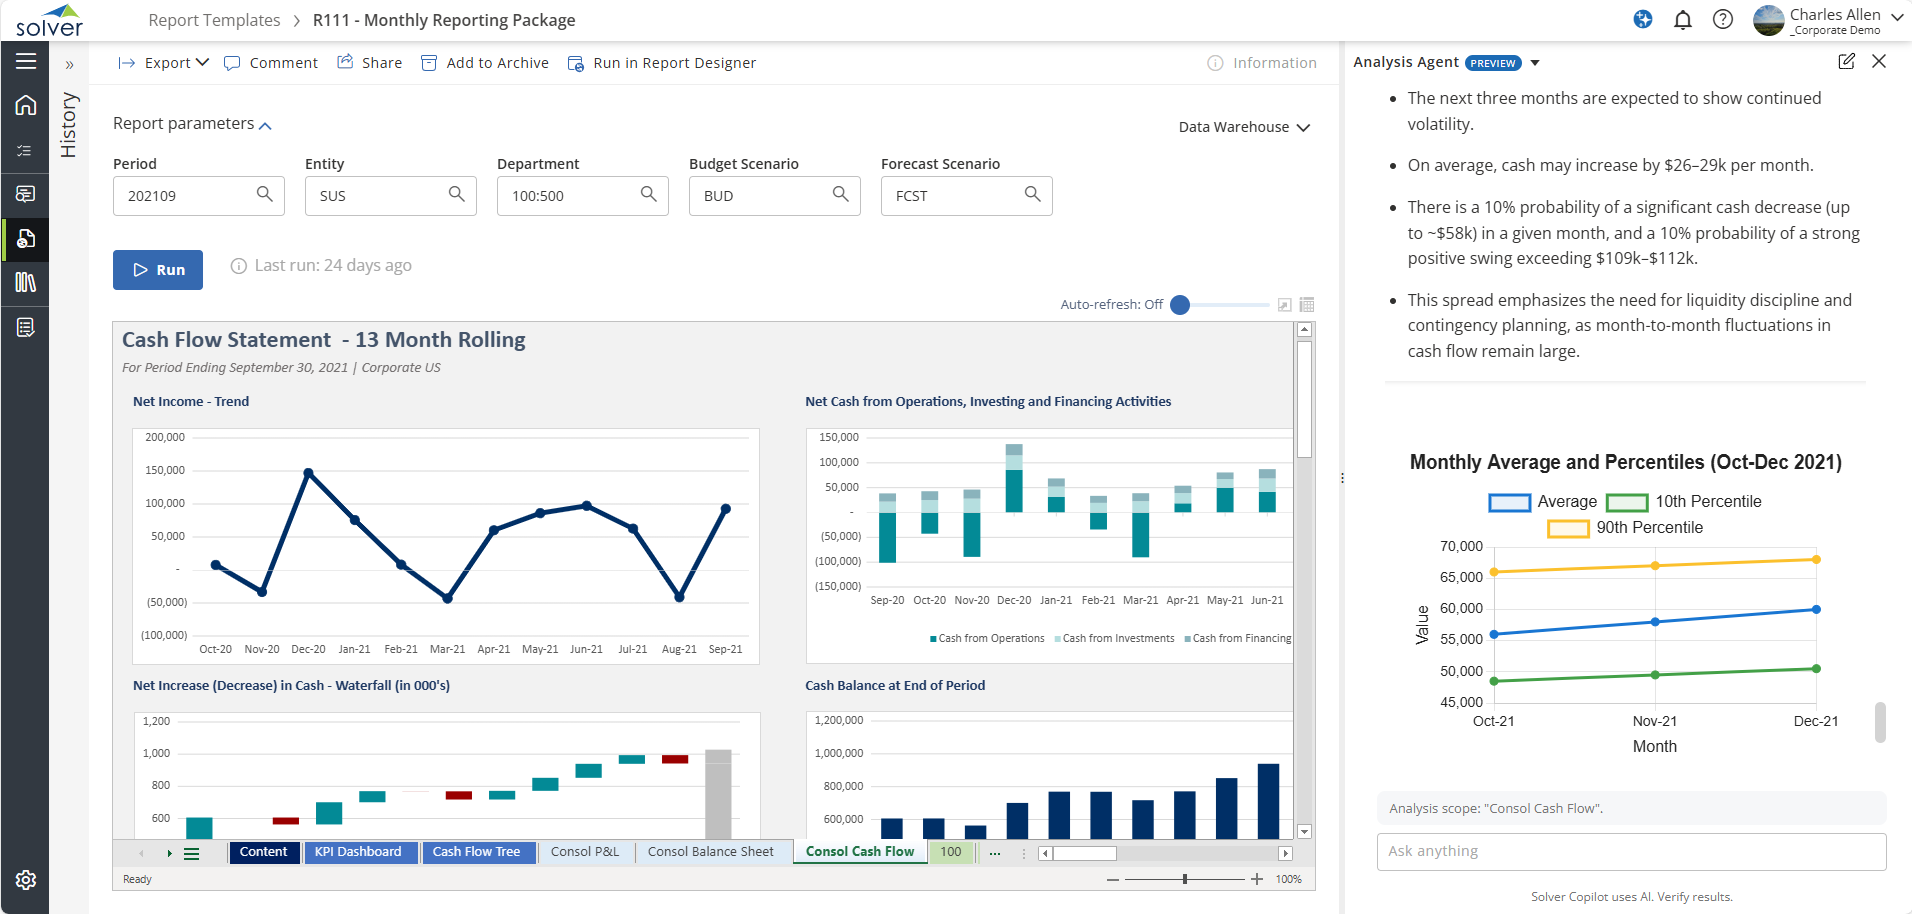 Click here to open in new tab.
These are just five examples of how Copilot can help companies analyze report data.
Keys to Success
While Copilot can help users get insights into their data, the key is how users engage with it and how they create the reports. To help users get the most out of Copilot, there are several recommended prerequisites described in this Solver overview. These recommendations are designed to create an environment where Copilot can provide clearer, more context‑aware responses:
- Use well-structured reports, not just tables of data.
- Use standard financial terminology, like Revenue, Expenses, and Net Income in your reports.
- Keep your reports smaller as opposed to larger.
- Ask clear questions with context.
What’s Next
Solver has indicated that it intends to expand the use of artificial intelligence (AI) within the platform throughout 2026 and beyond, further enhancing how users interact with their financial information.
How Forvis Mazars Can Help
Solver Copilot enables users to analyze reports. Users can ask questions about their report data and get answers. Using Copilot, well-structured reports, and good questions, users can glean insights that may help their companies find areas to increase revenue or decrease costs. In other words, Solver xFP&A Suite, under certain circumstances, may help companies make money.
At Forvis Mazars, we support organizations as they work to understand their financial information and use it to inform forward-looking decisions. Our professionals draw on experience across reporting, planning, and data-focused engagements to assist you in creating a reporting foundation that strengthens the value you can gain from tools like Solver and Copilot. Connect with us to learn more about how Solver xFP&A and its Copilot Analysis Agent can help you drive data-driven decision making in your organization.