
There is something for everyone. It is cyclical, but not predictable, because it might bring wetter conditions to some areas and drier to others every two years. Or every seven. Experts can’t agree on when it begins or ends, only that it’s impacted by changes in what ancient sailors called the trade winds – the air currents that moved cargo ships from from east to west along the equator.
Outside El Niño, the trade winds push deeper, cooler eastern Pacific waters toward the surface through the process upwelling. But during it the trade winds weaken, upwelling subsides, and surface waters stay warmer. Those warmer waters increase air pressure changes that further weaken trade winds, and we get the weather effects of El Niño.
A new paper examined the role of ocean salinity – salt distribution – in shaping El Niño events. This has not been addressed in models even though it’s know that ocean salt is not uniform. Some parts of the sea are saltier and that is impacted by rainfall, evaporation and other factors, which makes accurate models difficult. Ocean currents carry the saltier or fresher water and the effects of salinity variability and ocean currents and thus climate phenomena like El Niño aren’t well-known.
For the new work, the team used publicly available ocean data to identify global patterns in salinity that have preceded major El Niño events over the past 65 years. They found correlations between certain salinity patterns and El Niño and then used computer simulations to see if salinity patterns could alter El Niño conditions.
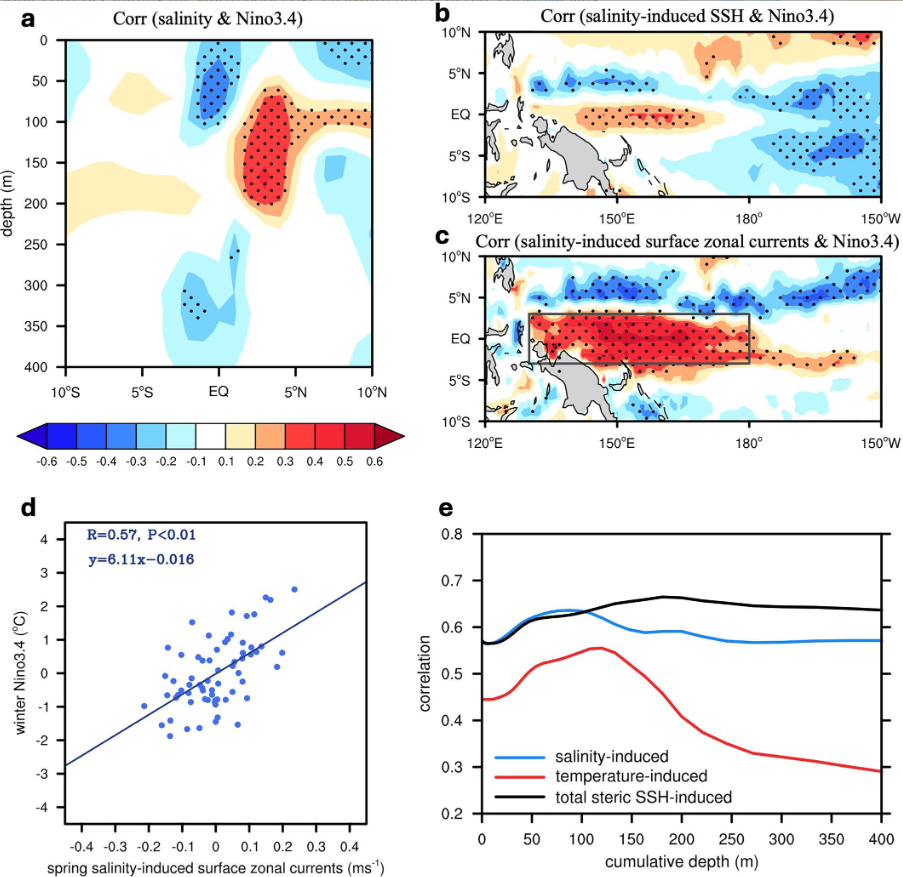
(a) The correlation coefficients between spring zonal mean (130°E−180°) salinity anomaly in the tropical western Pacific from surface to 400 m depth and the subsequent winter Niño3.4 index during 1958–2023. (b, c) Correlation coefficients between spring salinity-induced sea surface height (SSH) (b) and surface zonal currents (c) and the subsequent winter Niño3.4 index. Stippling in panels (a–c) indicates regions with correlations significant at the 95% confidence level. The colorbar below (a) is shared by panels (a–c). (d) Scatter plot showing the relationship between the winter Niño3.4 index and the domain-averaged (black box in c) spring salinity-induced surface zonal currents over the tropical western Pacific (3°S–3°N, 130°E−180°) for ORAS5 (Data and Methods) during 1958–2023 (blue dots with a correlation coefficient of 0.57). (e) Correlation coefficients between spring total steric SSH-induced surface zonal currents (black curve), salinity-induced surface zonal currents (blue curve), and temperature-induced surface zonal currents (red curve) and the subsequent winter Niño3.4 index, using SSH data integrated from the surface to varying depths for surface zonal current calculations.
The simulations found that certain salinity patterns can fuel El Niño strength. During springtime in the western Pacific, a combination of fresher water at the equator and saltier water farther away promote eastward ocean currents. Those currents push warm surface waters east that fuel El Niño development, the authors explained. They believe this can increase the intensity of El Niño by about 20% and make an extreme El Niño twice as likely, according to the study.
Citation: Liu, S., Hu, S.,&McPhaden, M. J. (2025). Salinity-induced eastward flow in boreal spring favors extreme El Niño. Geophysical Research Letters, 52, e2025GL118731. https://agupubs.onlinelibrary.wiley.com/doi/10.1029/2025GL118731