
Financial markets have proven to be the ultimate constraint on President Trump. That was true in April 2025, when tariffs on China rose to just under 150 percent and ensuing dysfunction in the US Treasury market forced the President to backtrack. It was also true – arguably – in January 2026, when a global spike in government bond yields coincided with the President backing down over Greenland.
Sharp moves in oil prices always carry financial stability risk. In March 2020, it was a sharp drop in oil prices that triggered global financial turmoil, which spilled back to the US Treasury market and – ultimately – necessitated massive emergency QE by the Fed. The sharp rise in oil prices now carries similar risk. In yesterday’s post, I flagged how the COVID inflation shock sparked multiple bond market blow-ups after central banks were forced to hike interest rates substantially. If oil prices remain at current levels or rise further, a repeat of such blow-ups is a real risk later this year. But there’s much more immediate financial stability risk, which is that highly levered positions in all kinds of corners of the market blow up as volatility increases. It looks to me like we’re nearing a breaking point on this front.
Last weekend, I wrote a post tracking the “fear factor” in spot and options markets. The former is where directional views are expressed, so – if you’re certain oil is going to rise – you’ll go long oil in this market. If, in contrast, you’re worried about rising uncertainty and tail risk, you’ll want to hedge that in options markets. Hedging often runs well ahead of directional views, so swings in options markets are usually more violent than in spot markets. When I wrote that post, markets were still well-behaved, but that’s changed over the past week. Across a number of fronts, the stress level in markets has risen appreciably. In my mind, this means the US is more likely to declare “mission accomplished” rather than escalate things by taking Kharg Island.
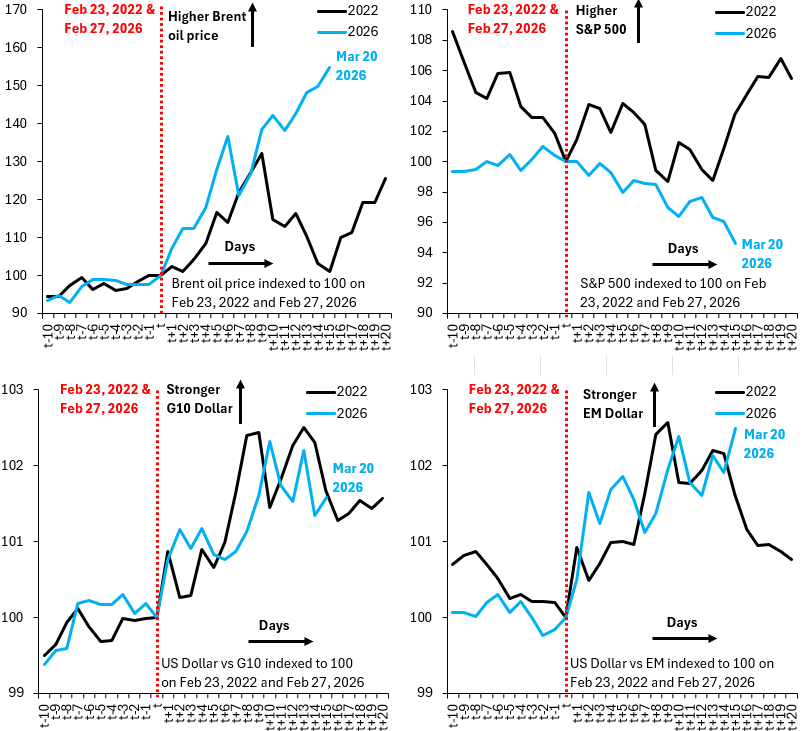
The four charts above are my tracking of what’s going on in spot markets. They show the evolution of the Brent oil price (top left), the S&P 500 (top right), the Dollar versus its G10 peers (bottom left) and the Dollar versus emerging markets (bottom right). The blue line is what’s happening now and the black line is what went on in 2022. In both cases, I’ve indexed things to be 100 the day before war began, which is Feb. 23, 2022, for Ukraine and Feb. 27, 2026, for Iran. It’s clear that we’re now tracking substantially worse than 2022 on Brent, the S&P 500 and emerging markets. Moves are still orderly, but they’re clearly headed in the wrong direction.
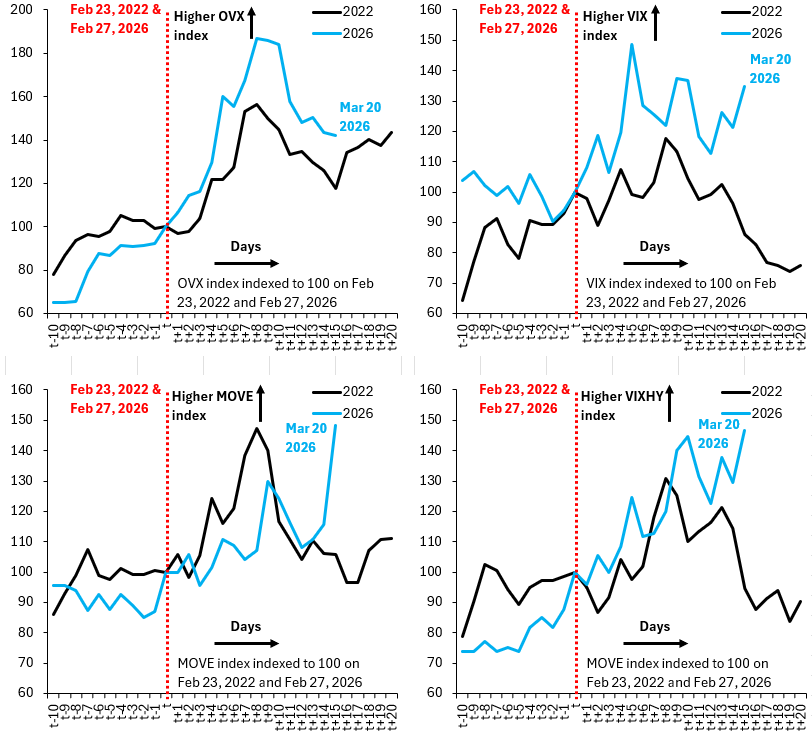
The four charts above are my tracking of what’s going on in options markets. They show 30-day ahead implied volatility for crude oil (top left), the S&P 500 (top right), the bond market (bottom left) and the high yield corporate debt market (bottom right). A rise in implied volatility signals increased demand for hedging as markets brace for more uncertainty. That’s clearly true for the S&P 500, the MOVE index and VIXHY.
The overall picture is quite alarming. Where markets were well-behaved a week ago, there’s now mounting signs of stress, with oil prices embedding a much bigger risk premium than in 2022. My personal view – which you can view here in this week’s discussion with Paul Krugman – is that oil prices are near their peak, in part because the Trump administration is mindful of how fragile financial markets are. I sincerely hope I’m not wrong. Any escalation that sparks another spike in oil prices may be extremely destabilizing to markets.