-
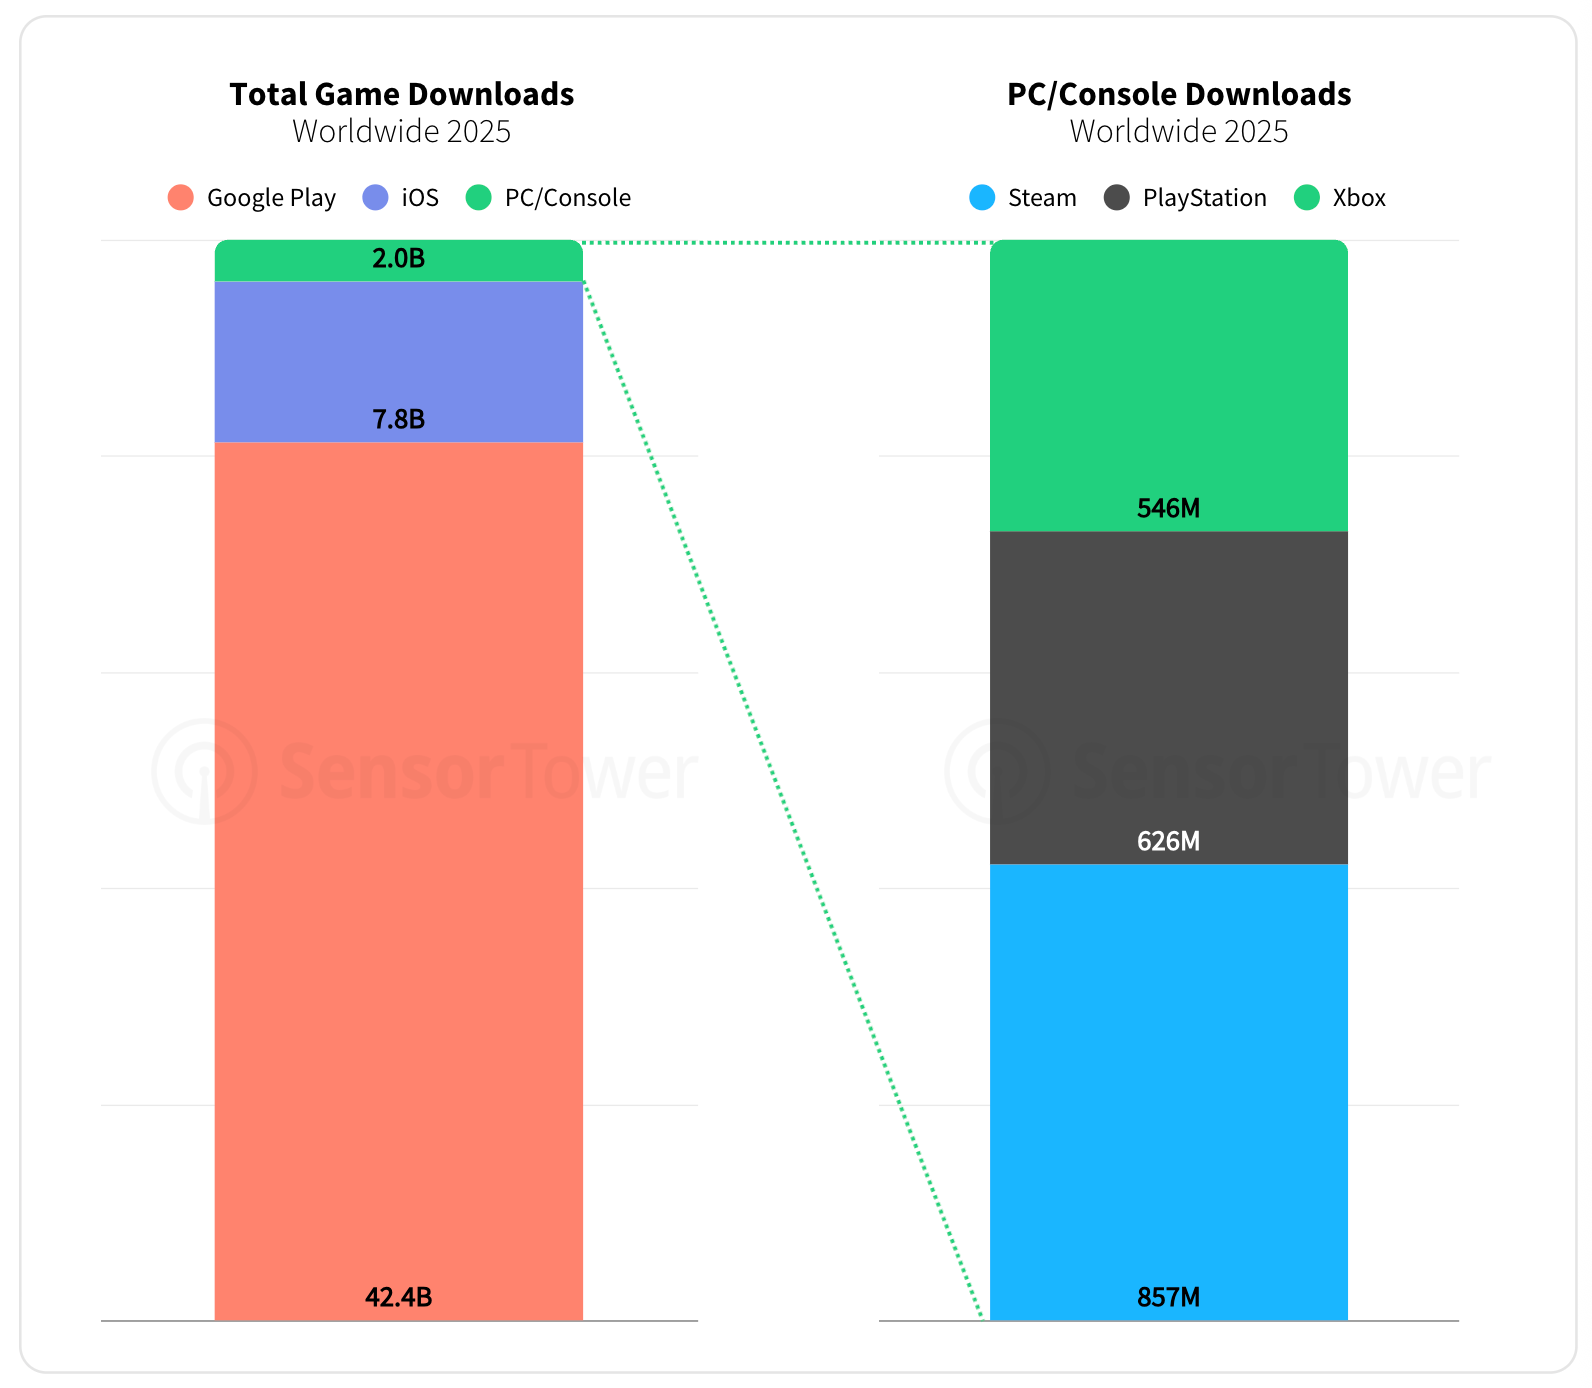
Games were downloaded over 52 billion times in 2025, with more than 50 billion of those coming from mobile devices.
-
Google Play accounts for 81% of all installs, App Store for 15%, and all PC platforms and consoles combined make up just 4%.
-
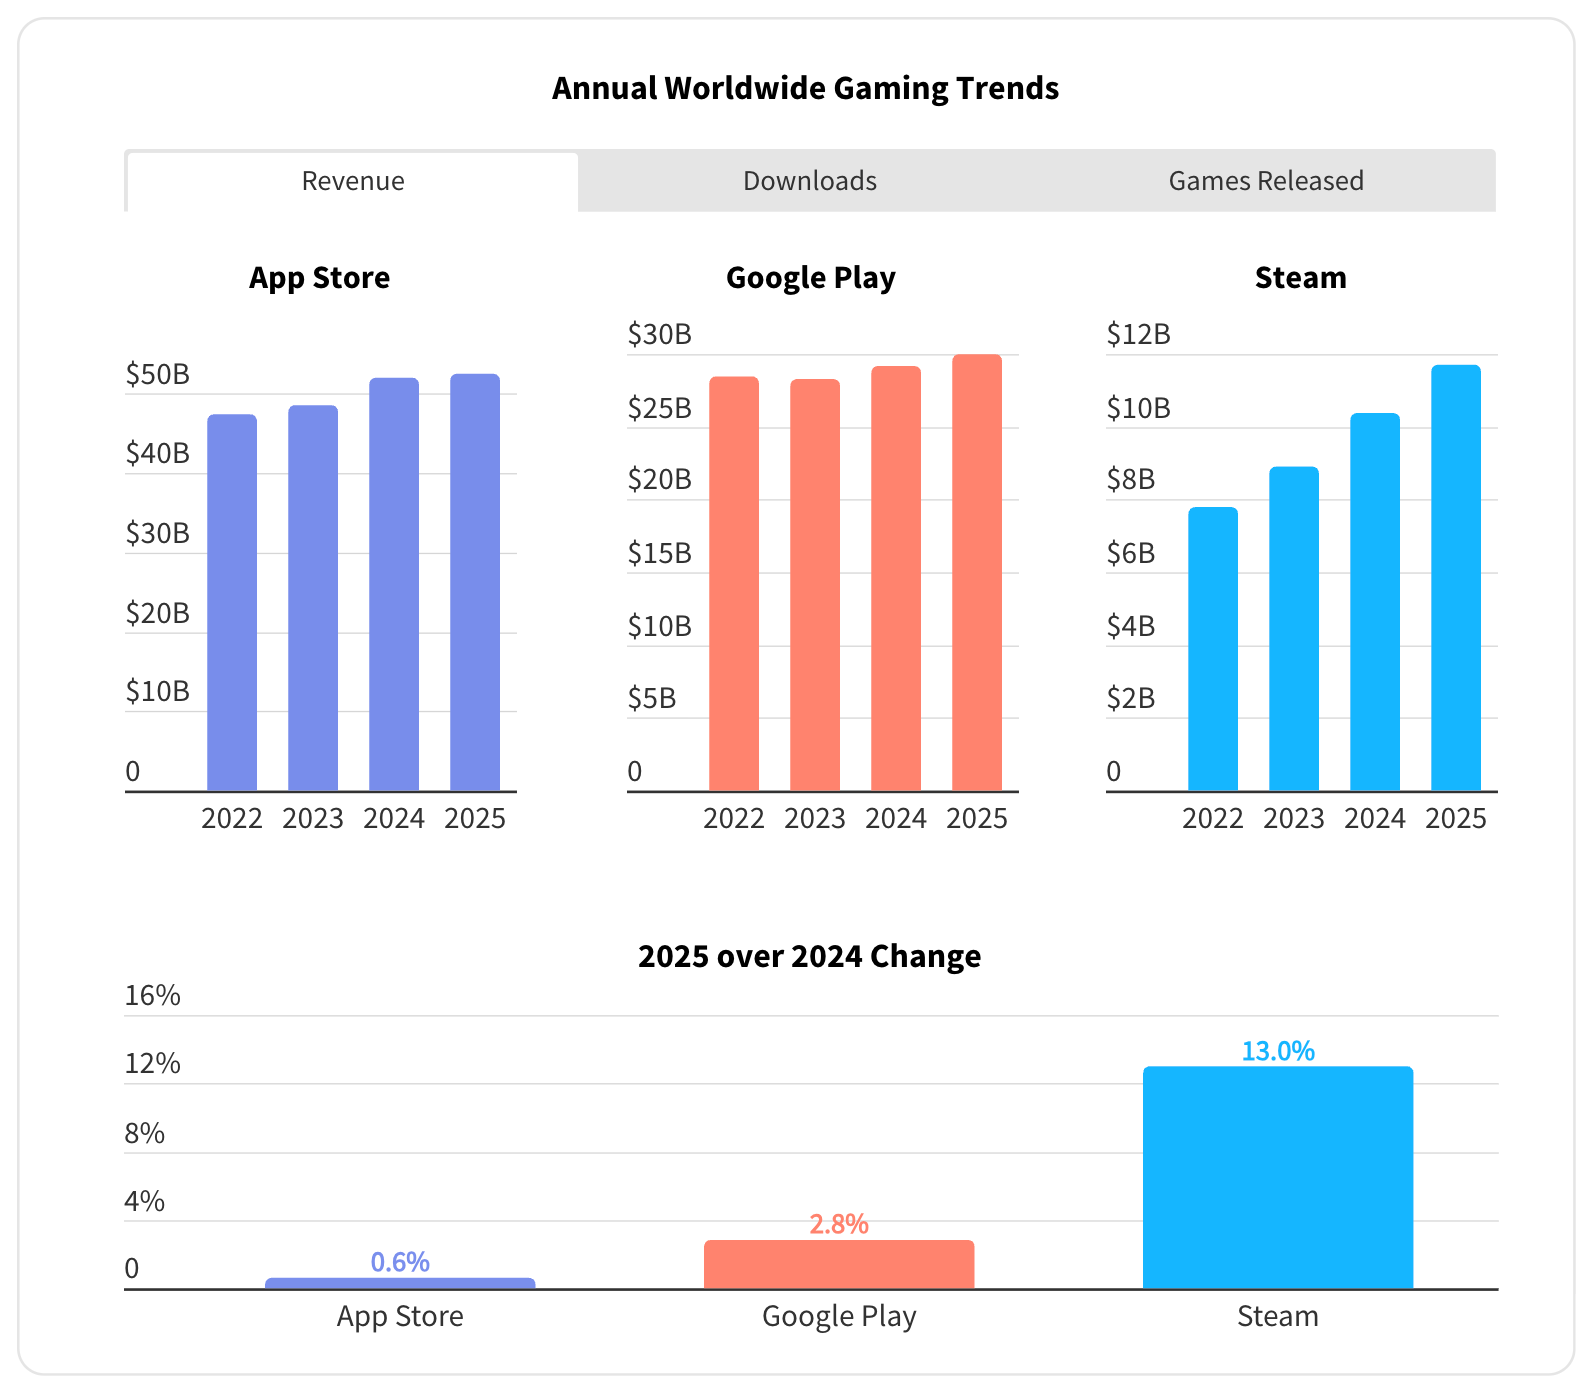
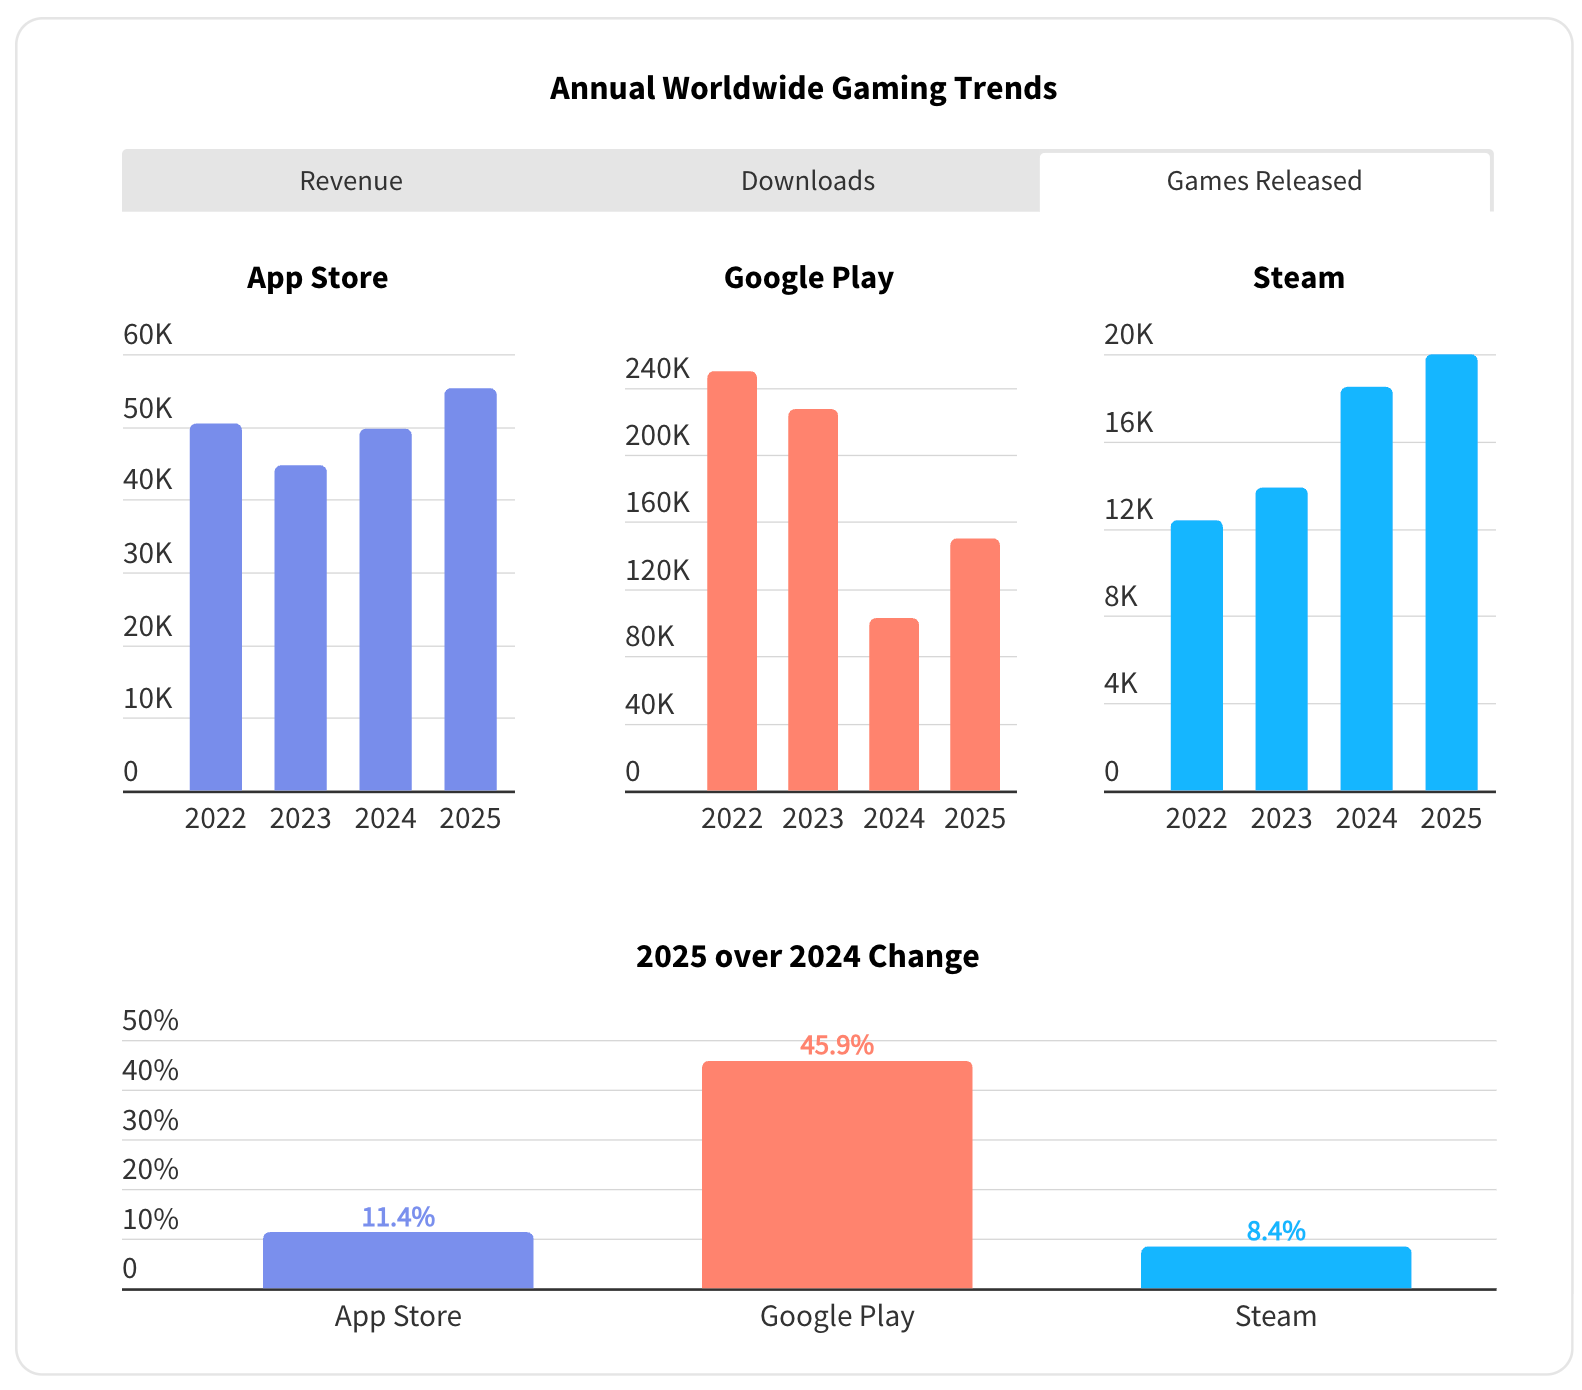
In terms of revenue growth, the App Store nearly plateaued in 2025, growing just 0.6% to $52.5 billion. Google Play grew 2.8% to $30 billion. Steam, on the other hand, was up 13% to $11.7 billion.
-
Downloads are declining on both the App Store (-5.7% YoY, 7.8 billion installs) and Google Play (-7.3% YoY, 42.4 billion installs). Steam showed growth (+6% YoY), but its base is nowhere near mobile (857 million installs in 2025).
-
The number of games released is growing on every platform. App Store reached 55,300 titles (+11.4% YoY), Google Play saw over 150,000 games (+45.9% YoY), and Steam hit 20,000 (+8.4% YoY).
-
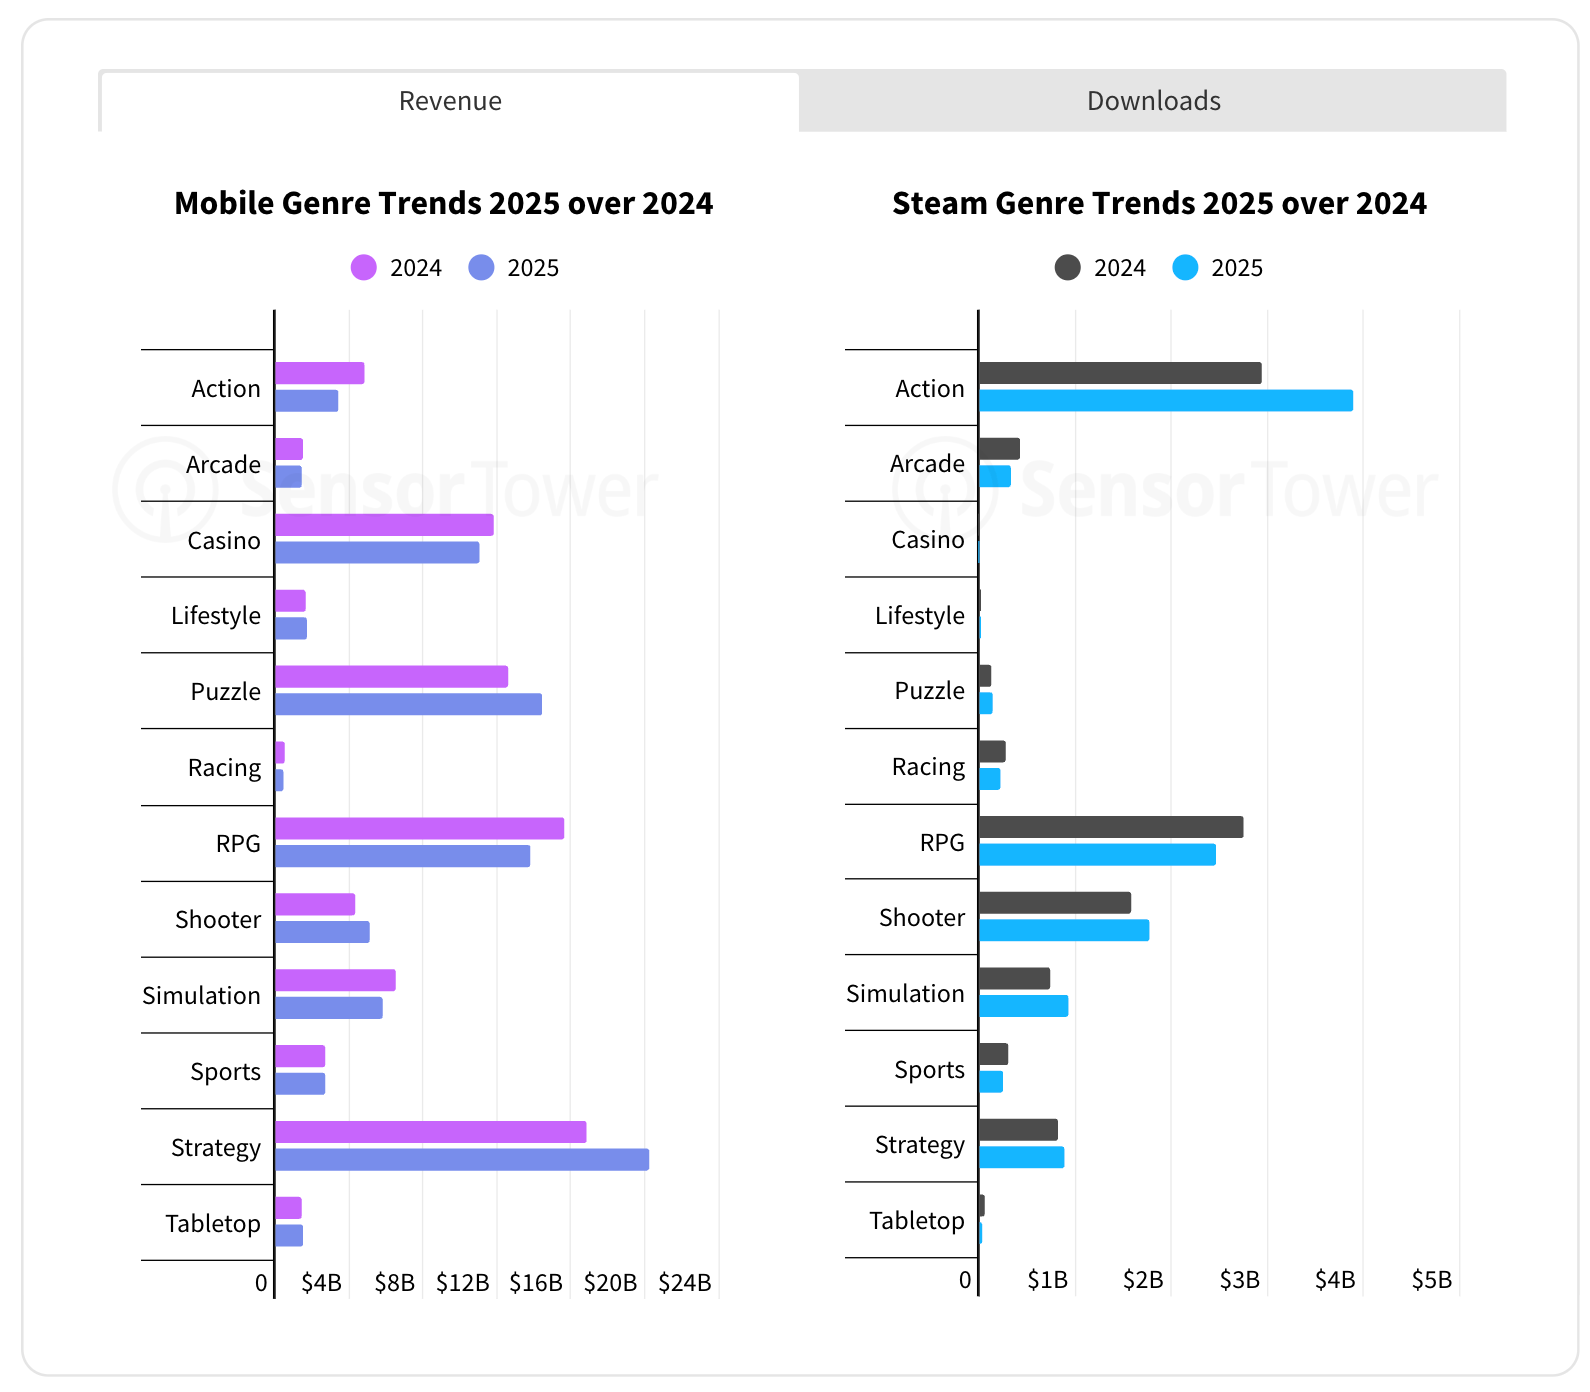
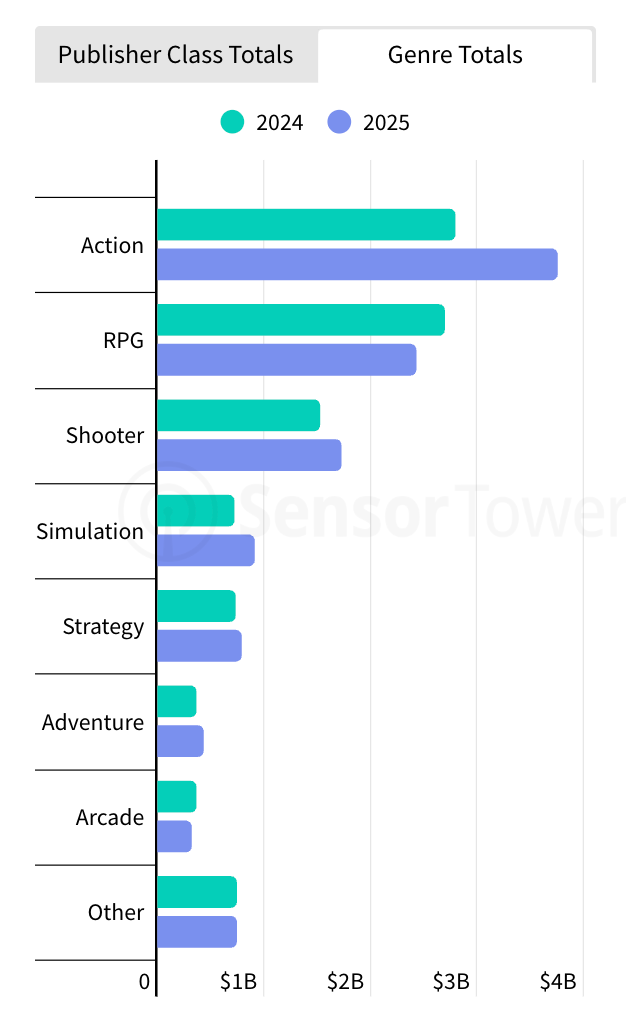
On mobile in 2025, the strongest growth came from strategy ($20.2 billion) and puzzle ($14.4 billion). On Steam, action ($3.88 billion) and shooters ($1.77 billion) led the way. RPG remains one of the largest segments on both mobile and Steam, but is in decline on both.
-
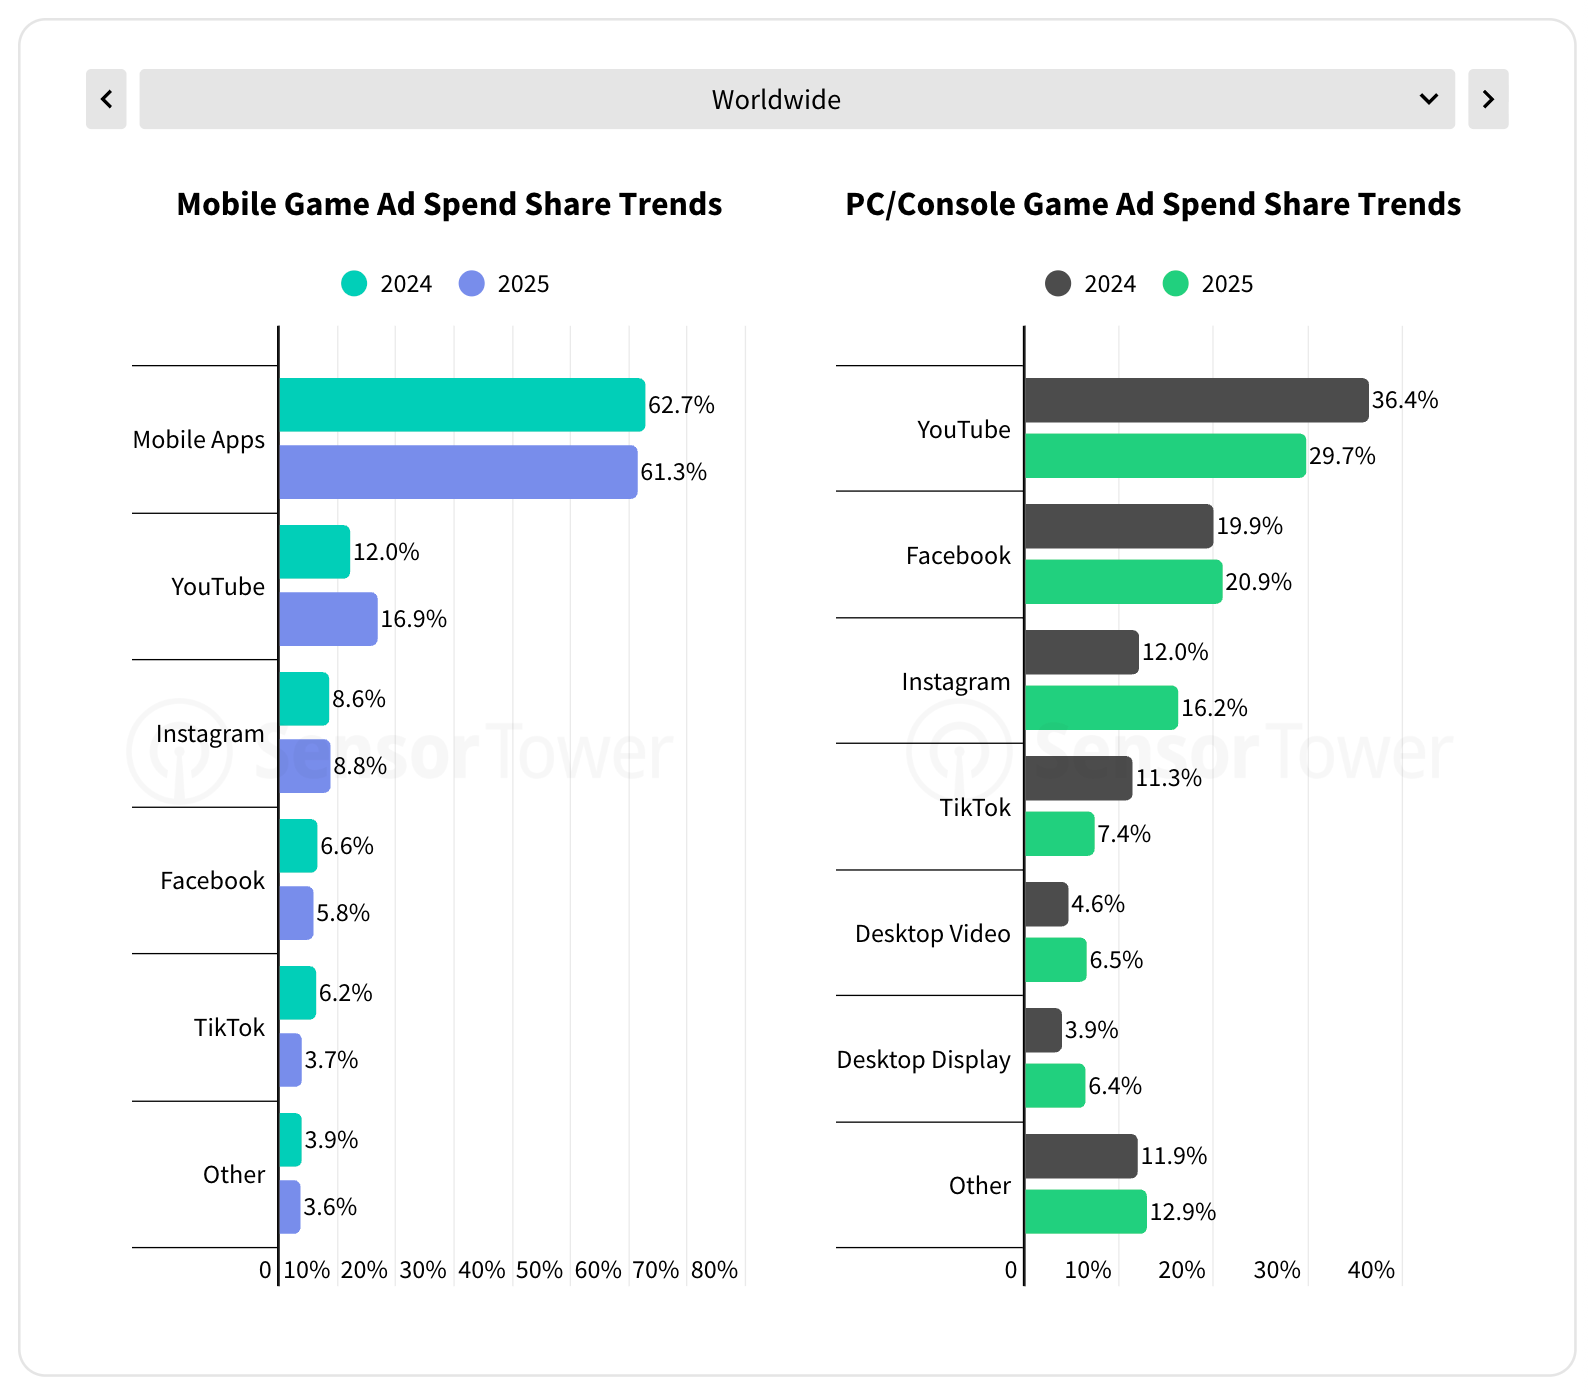
In terms of marketing spend, mobile games allocate most of their budgets to in-app advertising (which makes sense). PC/console games, on the other hand, invest heavily in YouTube and social media: Facebook, Instagram, and TikTok.
-
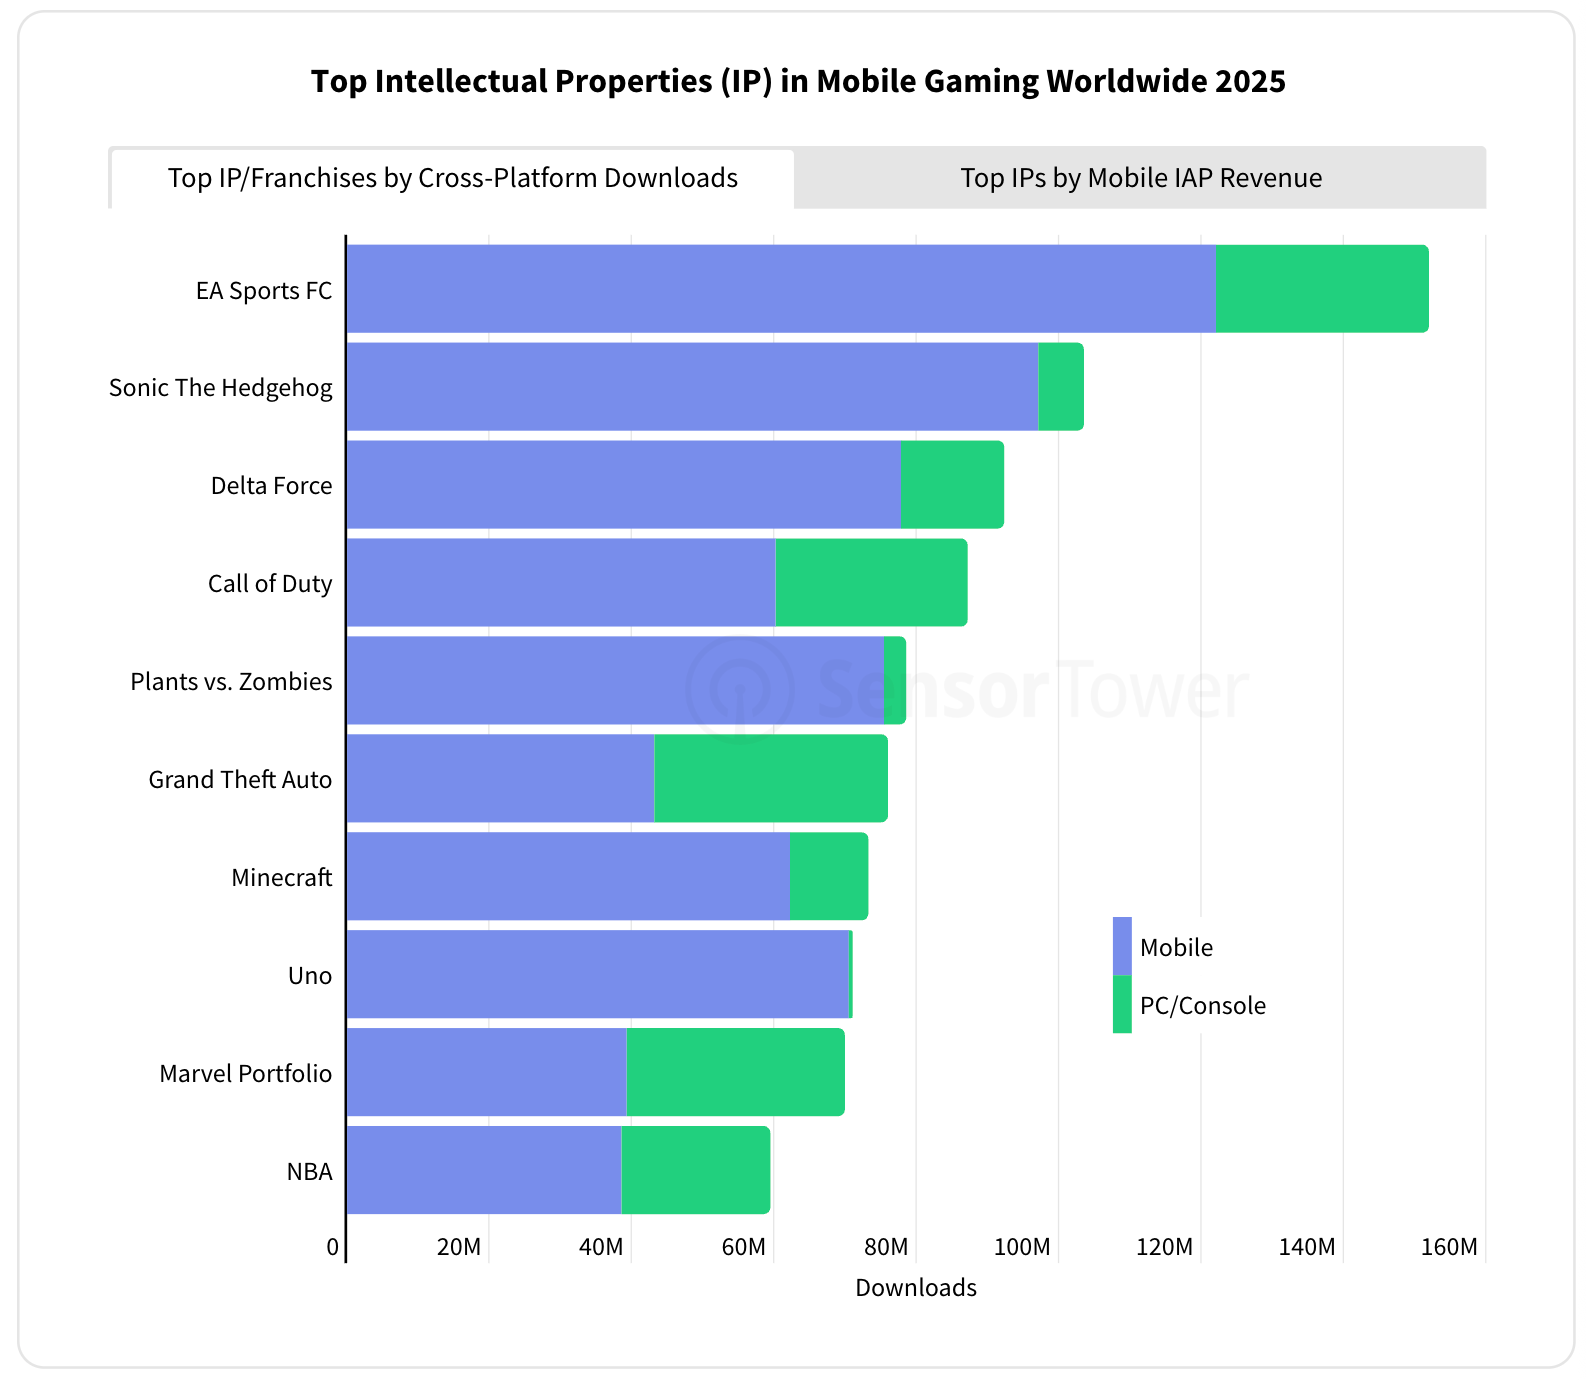
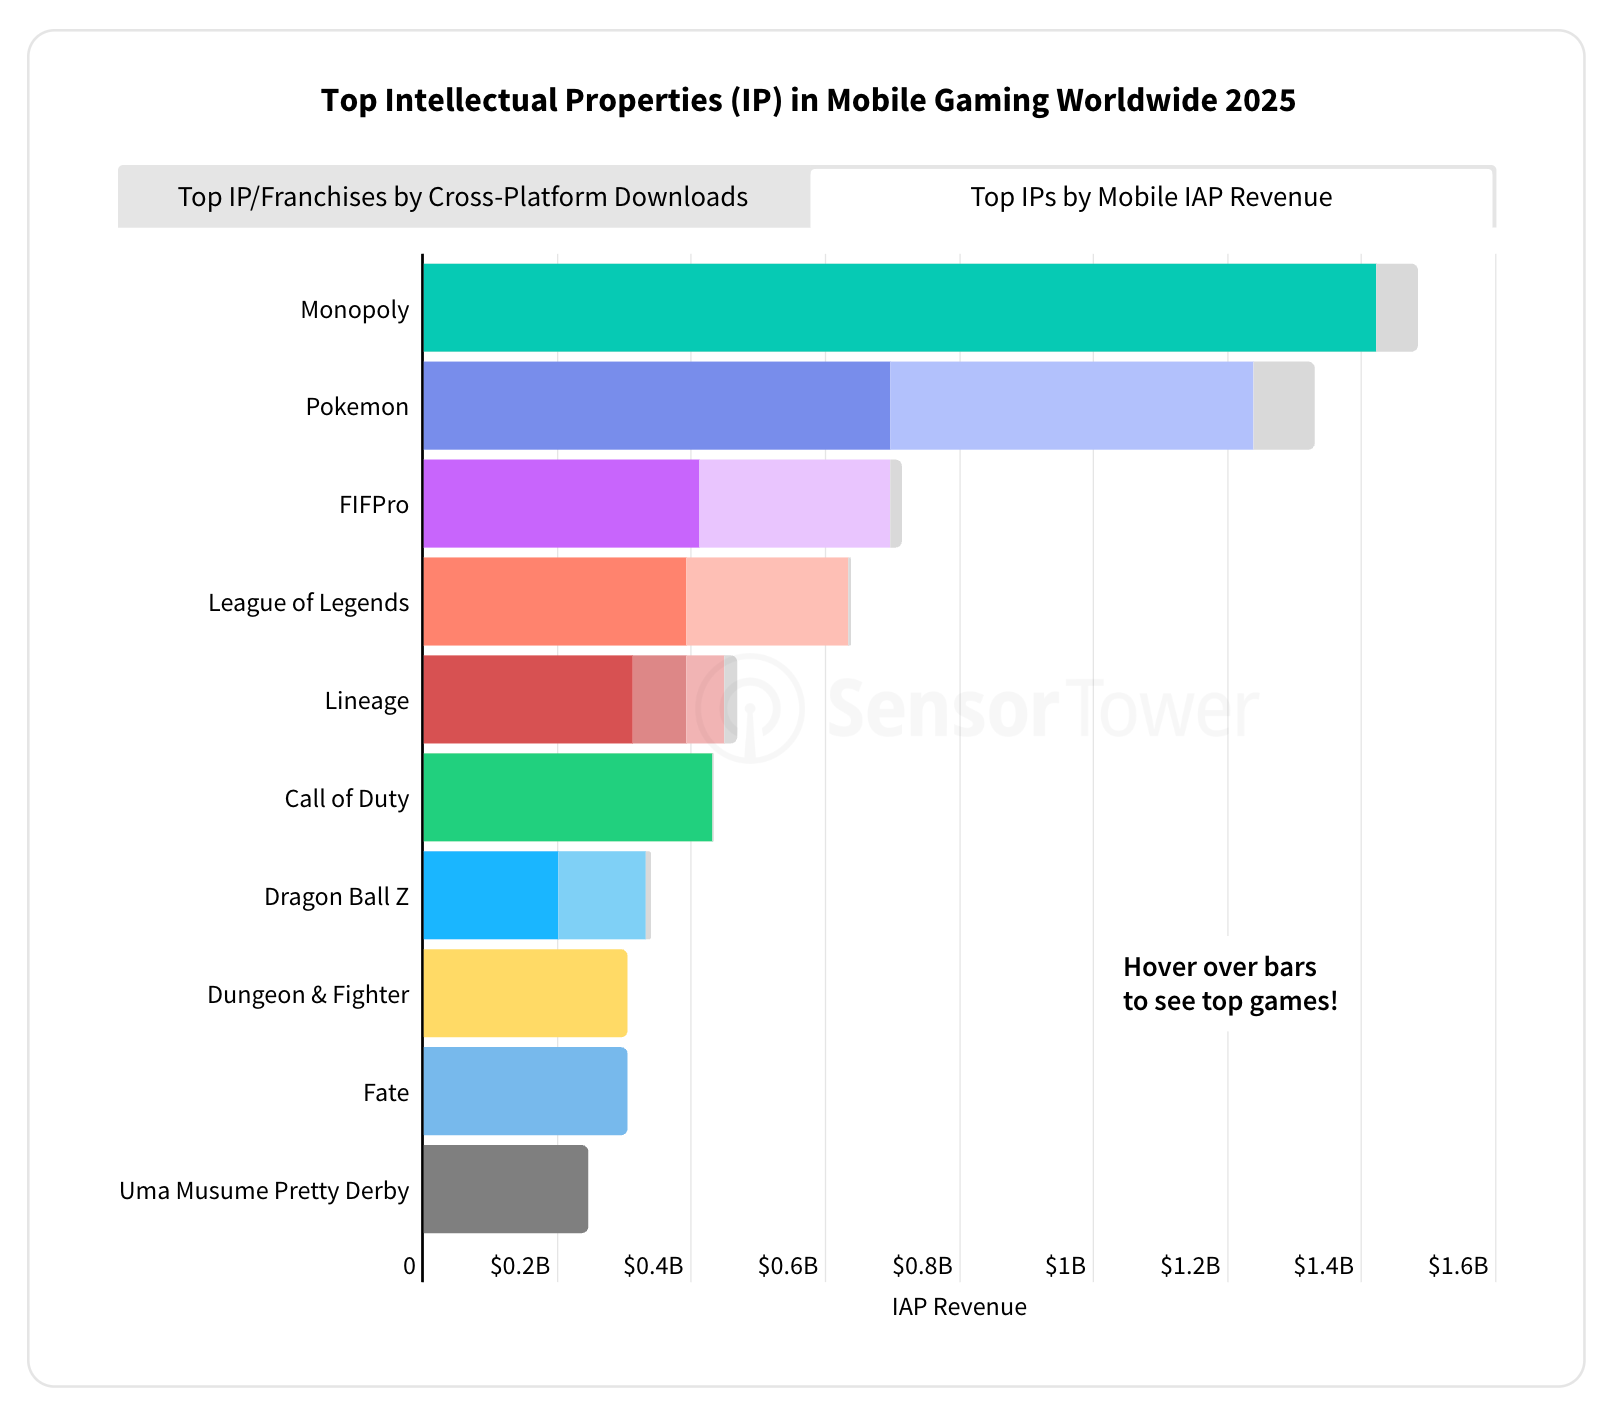
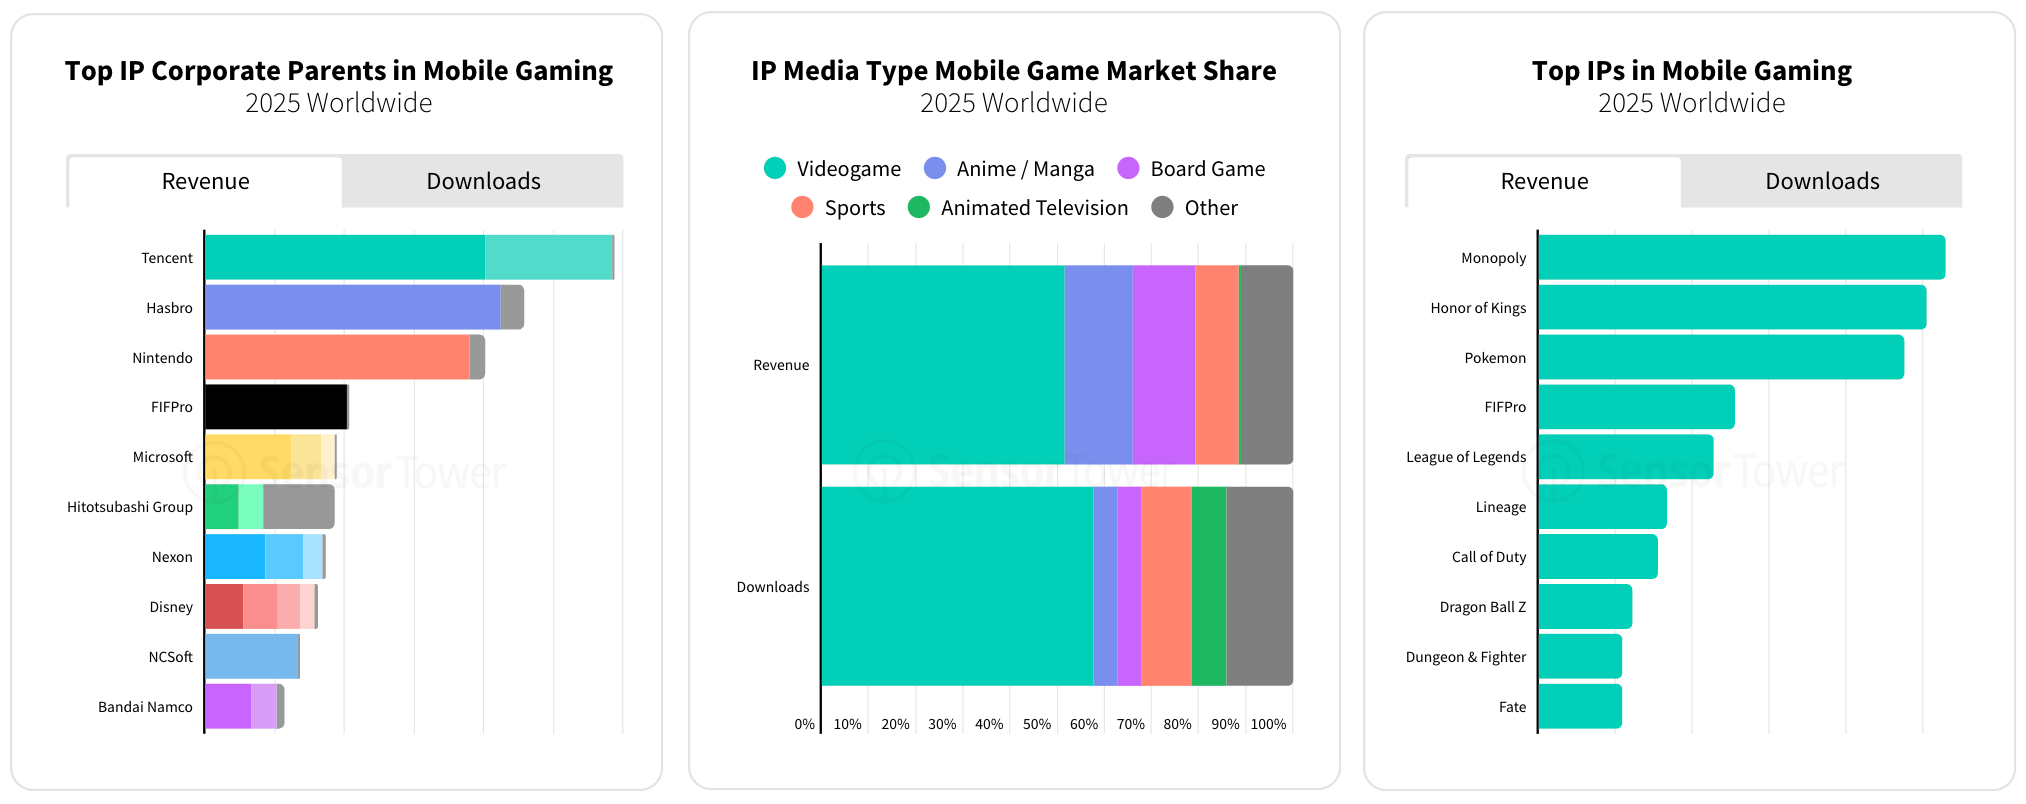
By revenue, the leaders are Monopoly, Pokémon, and FIFPro (which covers all mobile projects with football licenses).
-
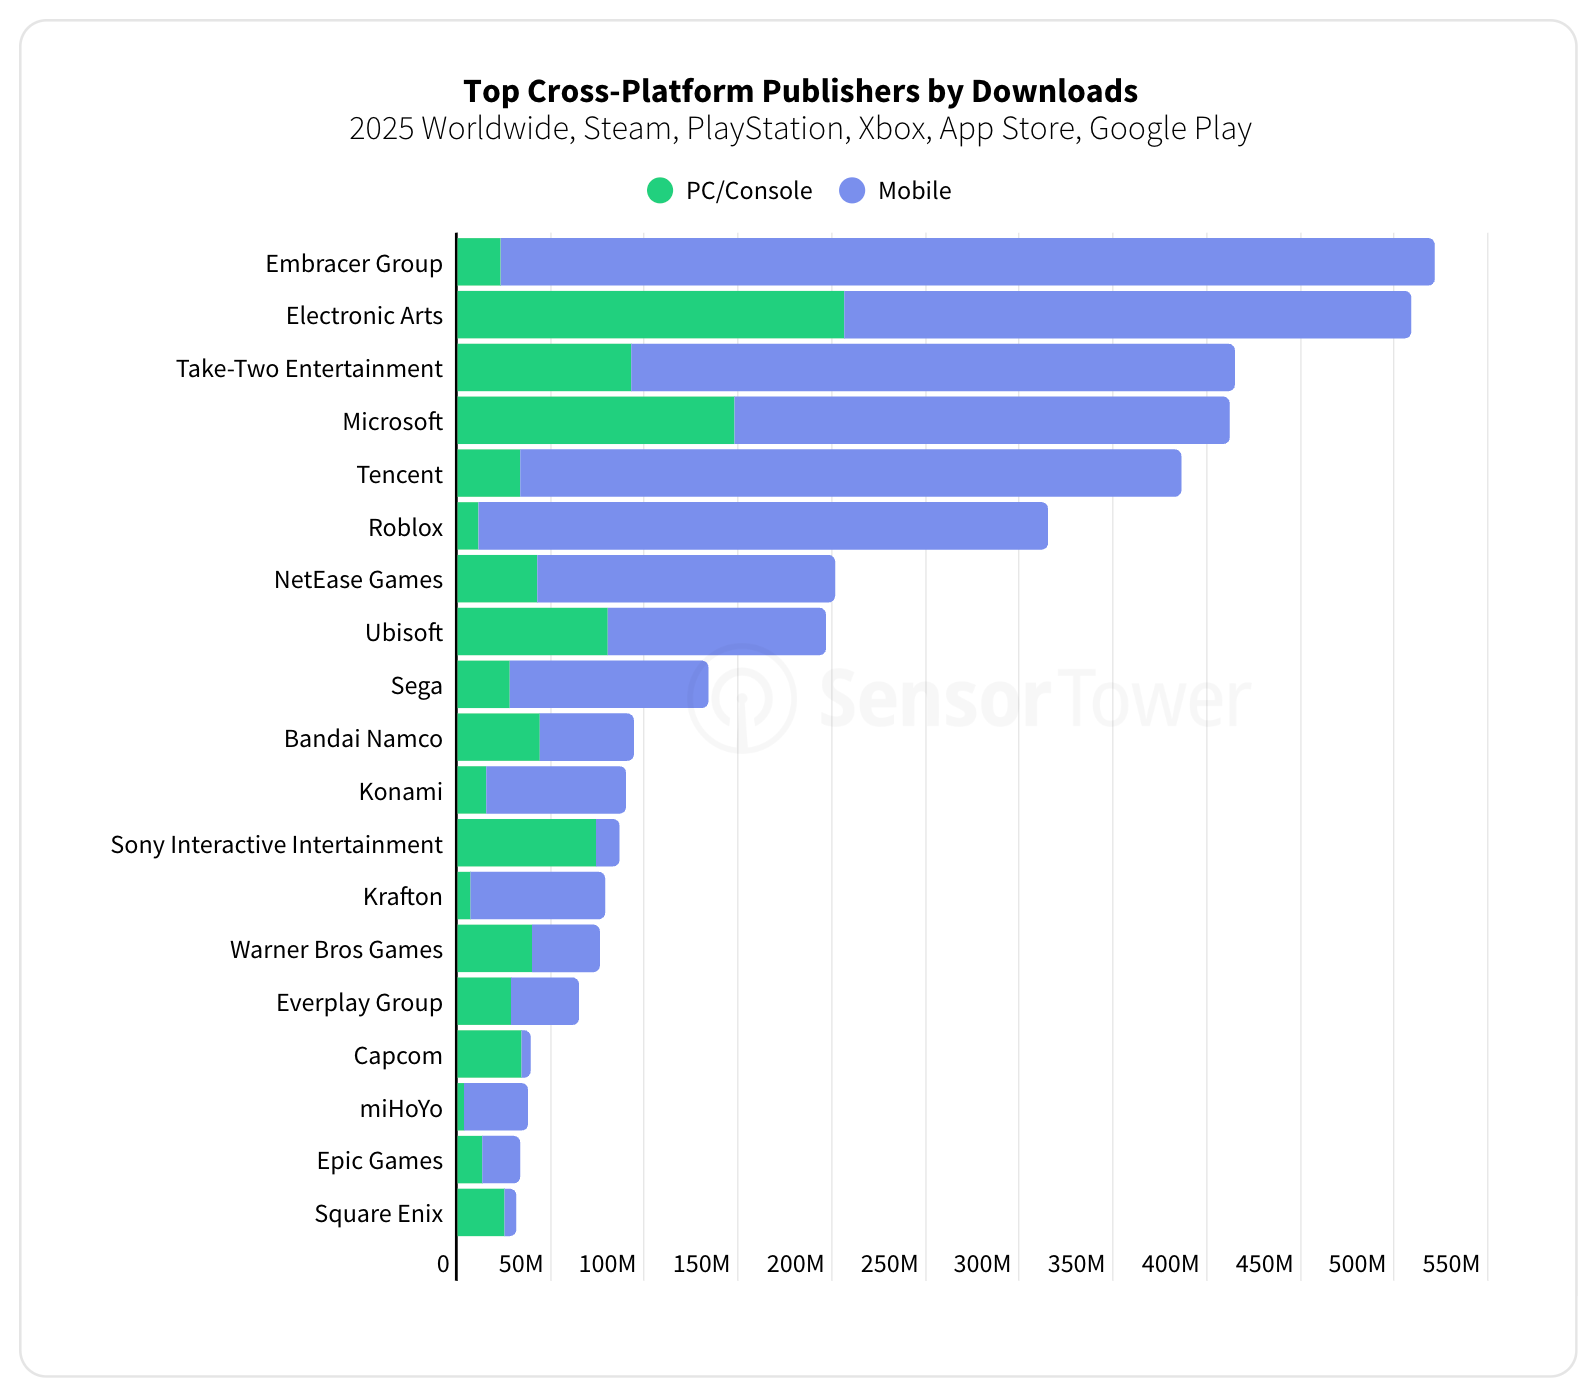
According to Sensor Tower, among cross-platform publishers, Embracer Group leads downloads in 2025. Though these numbers feel odd: by the end of 2025, the company’s only mobile division was DECA Games, as Easybrain had been acquired by Miniclip (Tencent). I’m not sure of the validity of this particular chart.
-
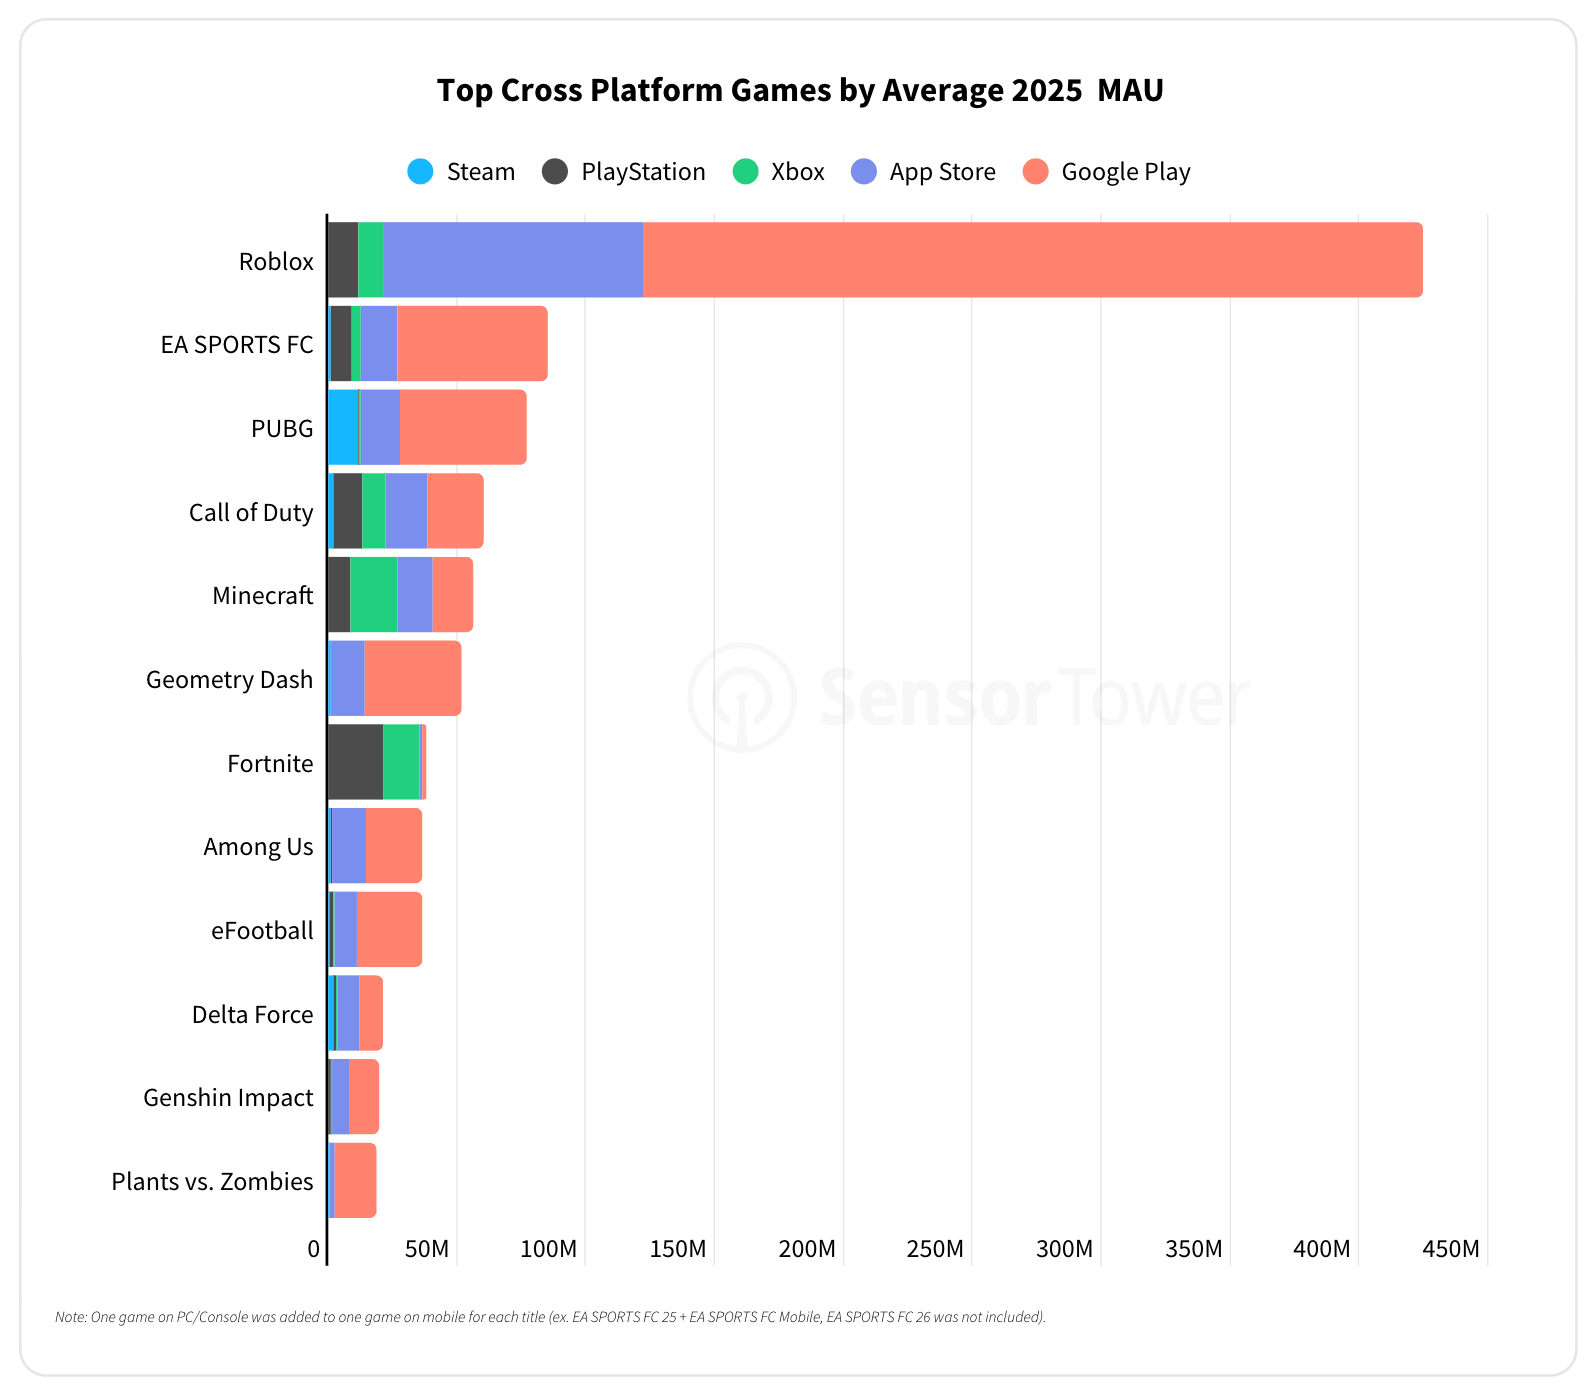
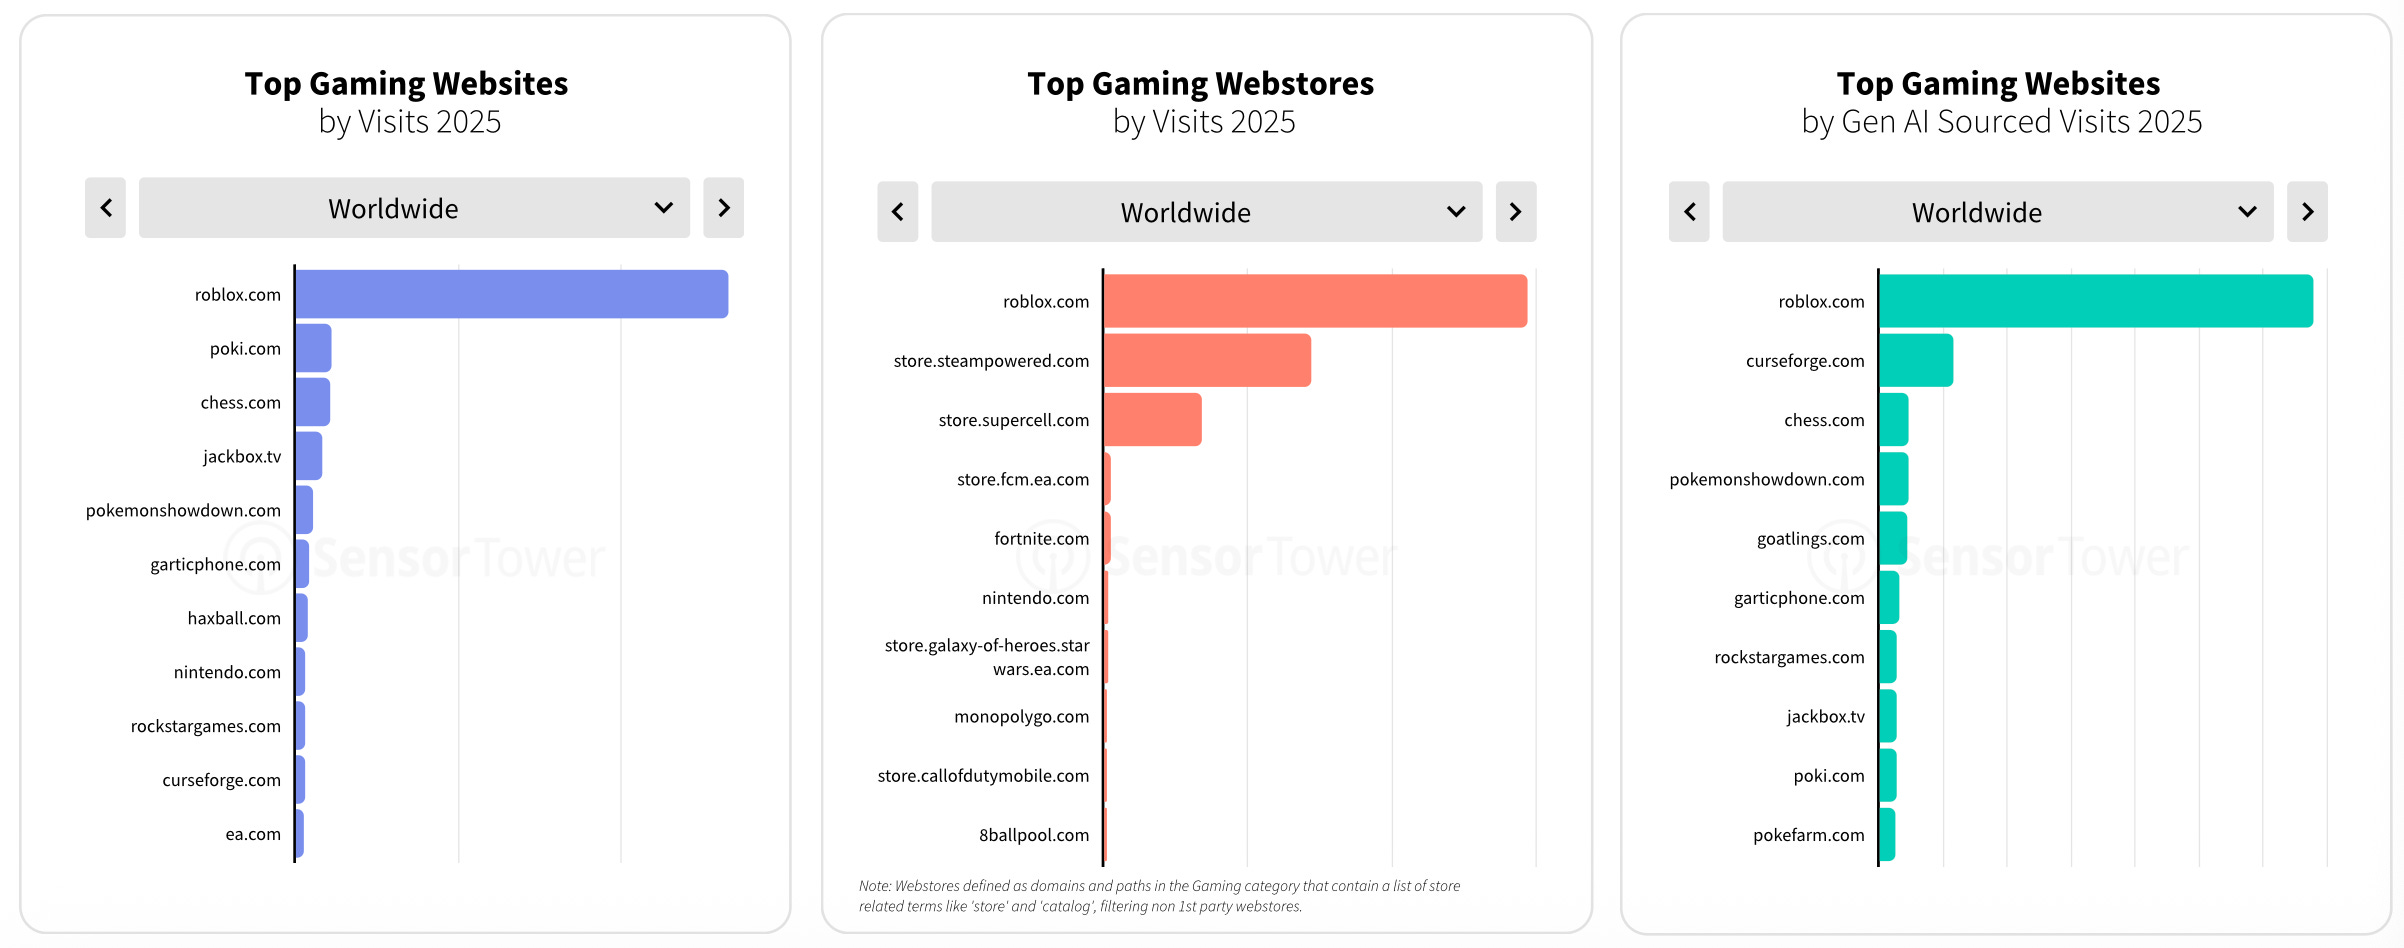
Roblox topped all gaming websites, web shops, and platforms in popularity. The scale just makes the charts hard to read.
A word from our sponsor
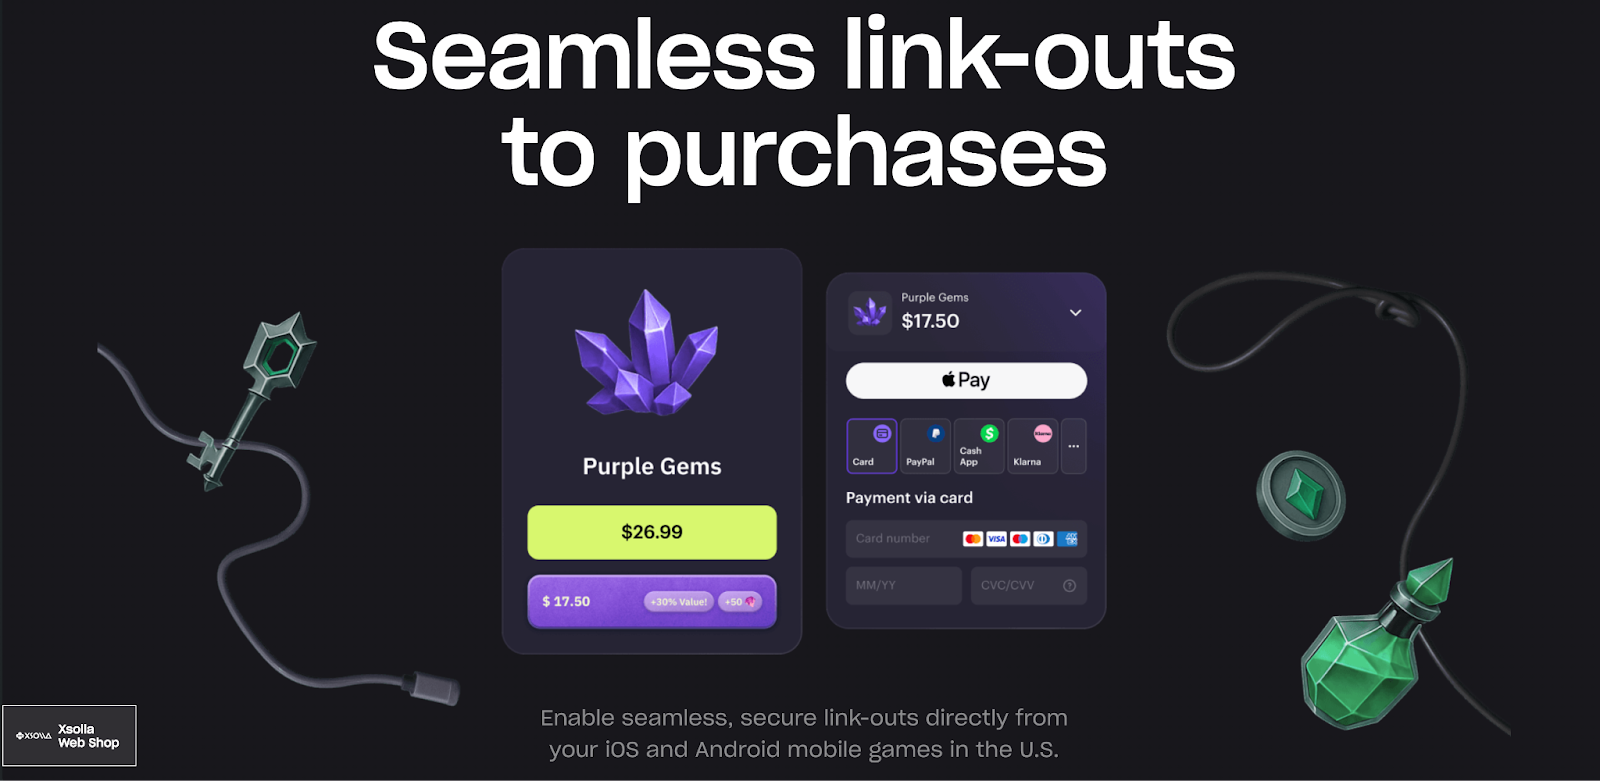
Boost your game’s revenue with Xsolla’s Buy Button, enabling secure 1-tap purchases via Apple Pay, Google Pay, and saved cards. Leverage Apple’s 2025 update allowing external purchase links in the U.S. to reduce platform fees and increase control over monetization. Sync offers in-game events via API, driving player retention with dynamic bonuses, discounts, and loyalty rewards – all in a seamless, familiar payment flow that maximizes conversions.
-
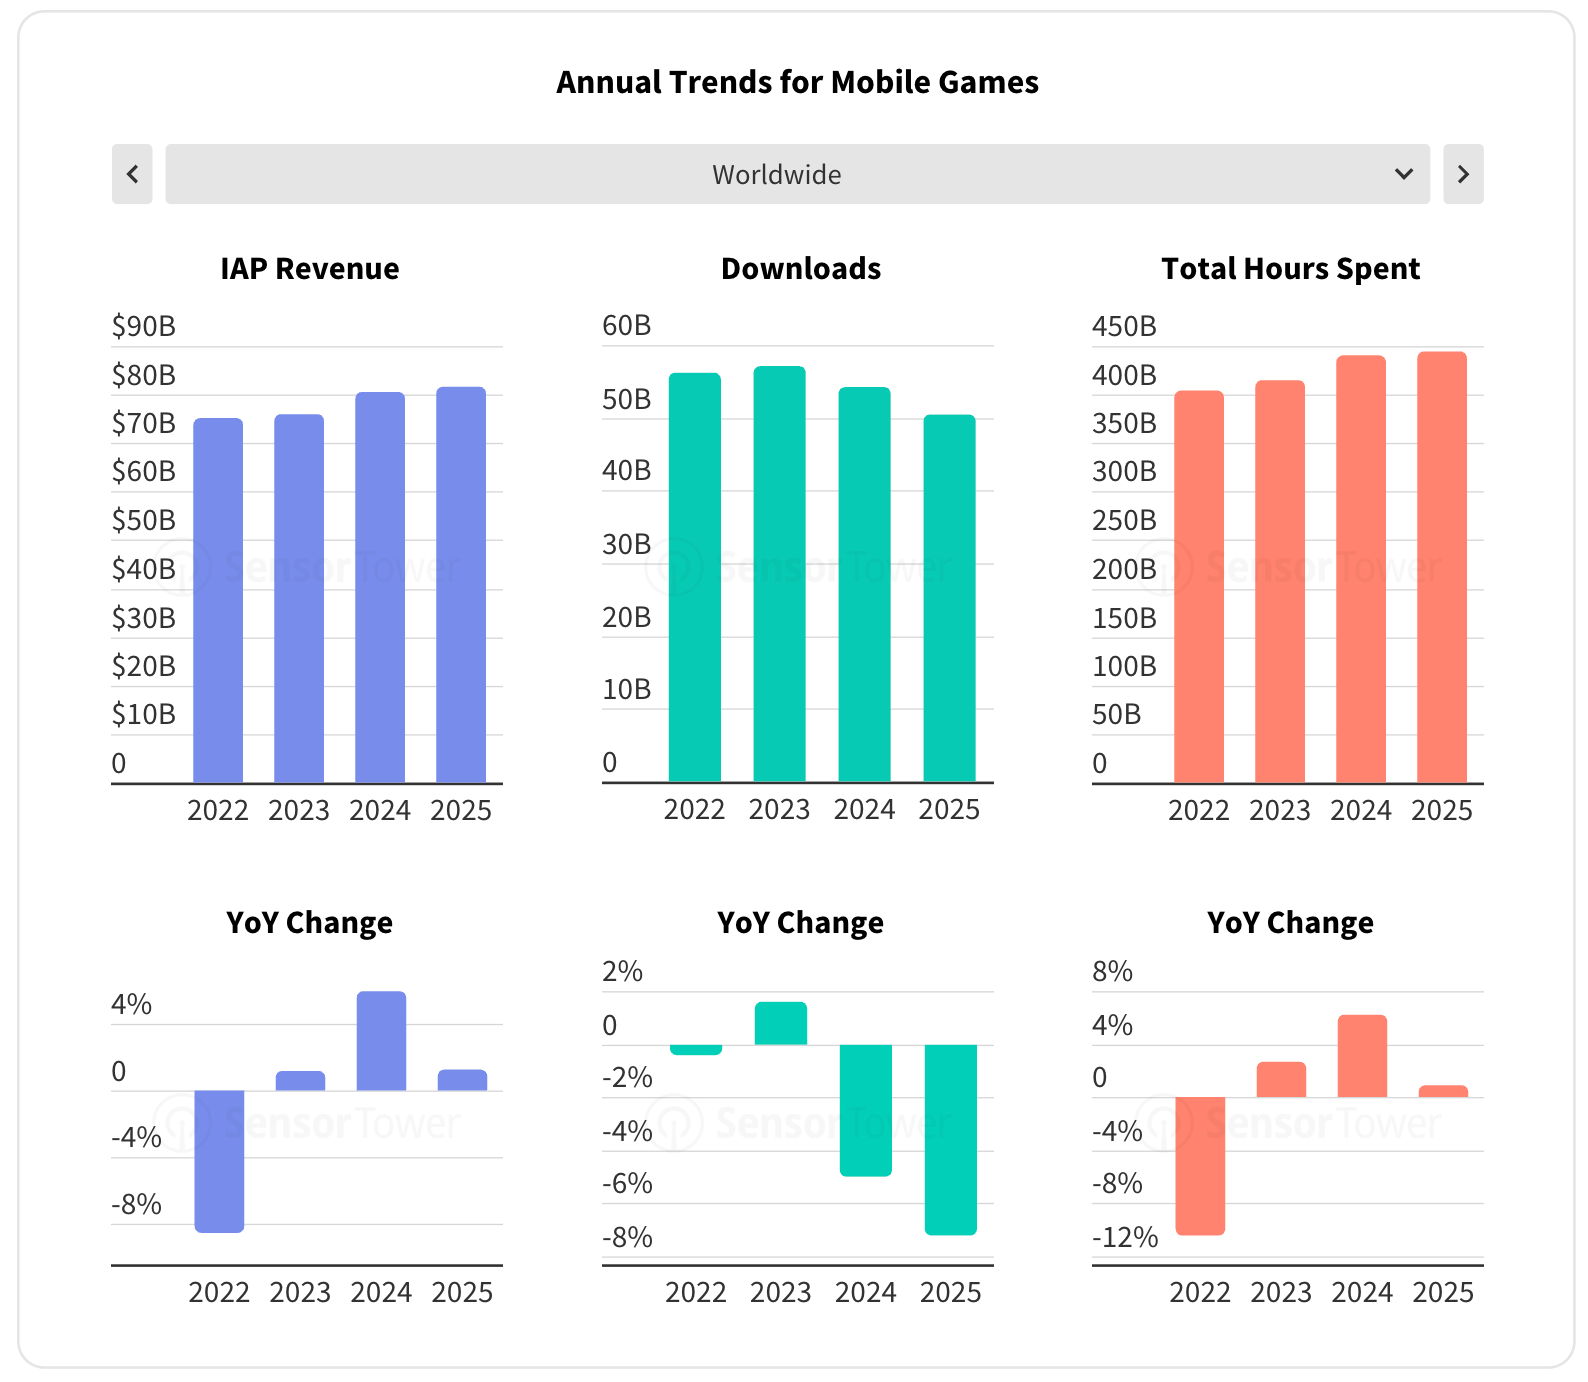
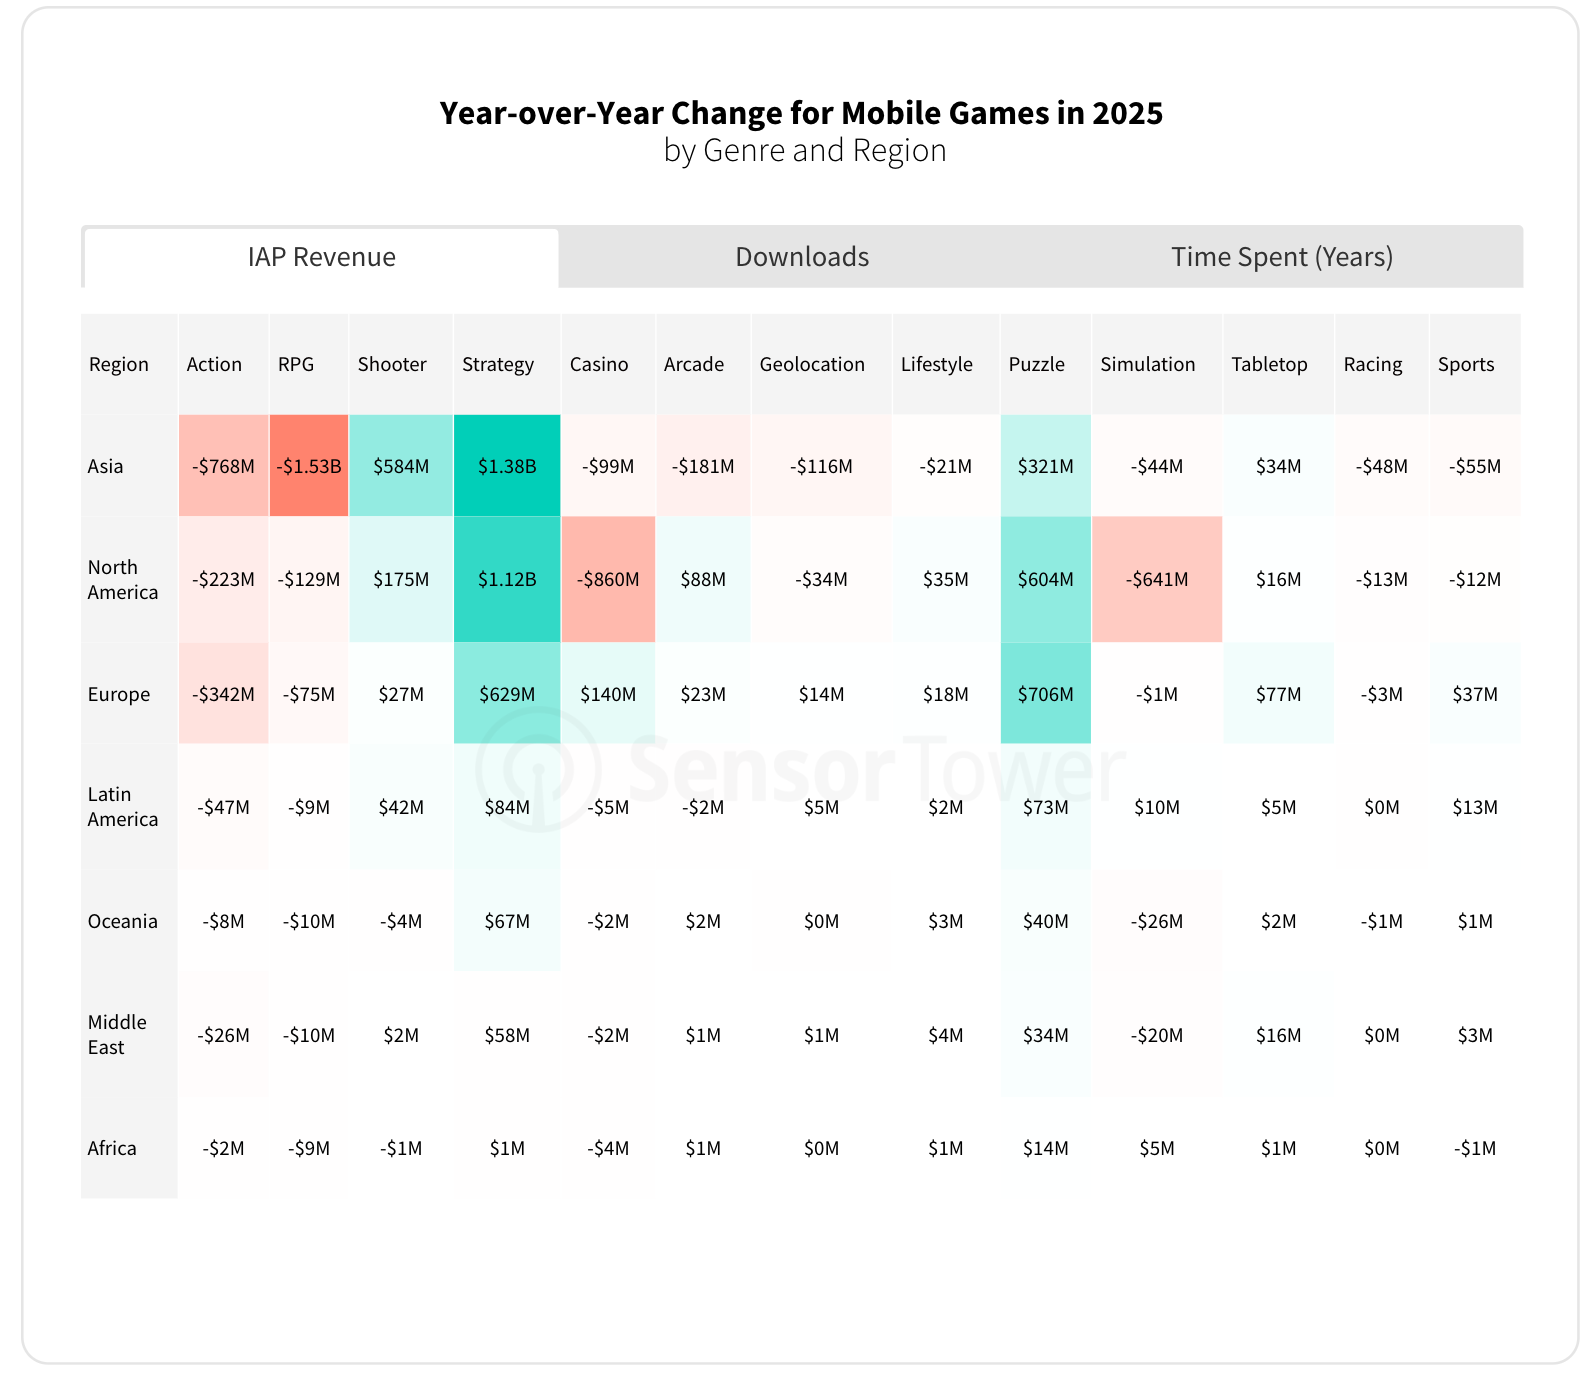
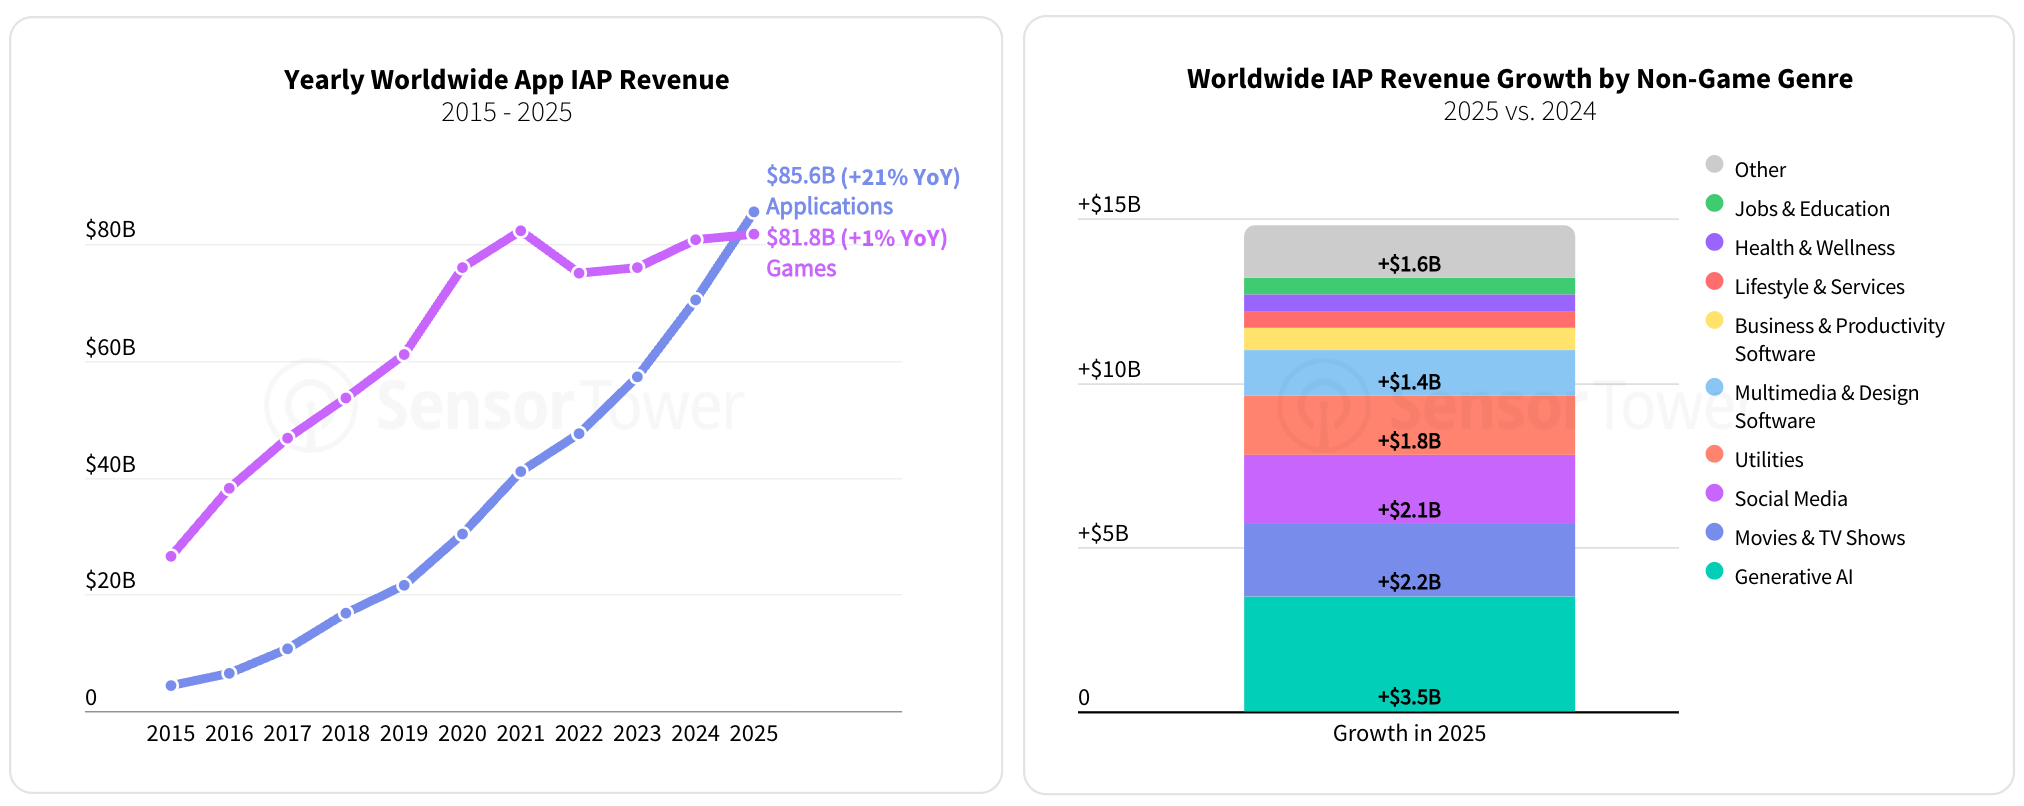
Mobile game IAP revenue grew to $81.75 billion in 2025 (+1.3% YoY). That’s three consecutive years of growth, modest, but growth.
❗️A note on inflation: adjusted for it, the trend is likely negative. That said, inflation varies across countries, spending categories, and companies.
-
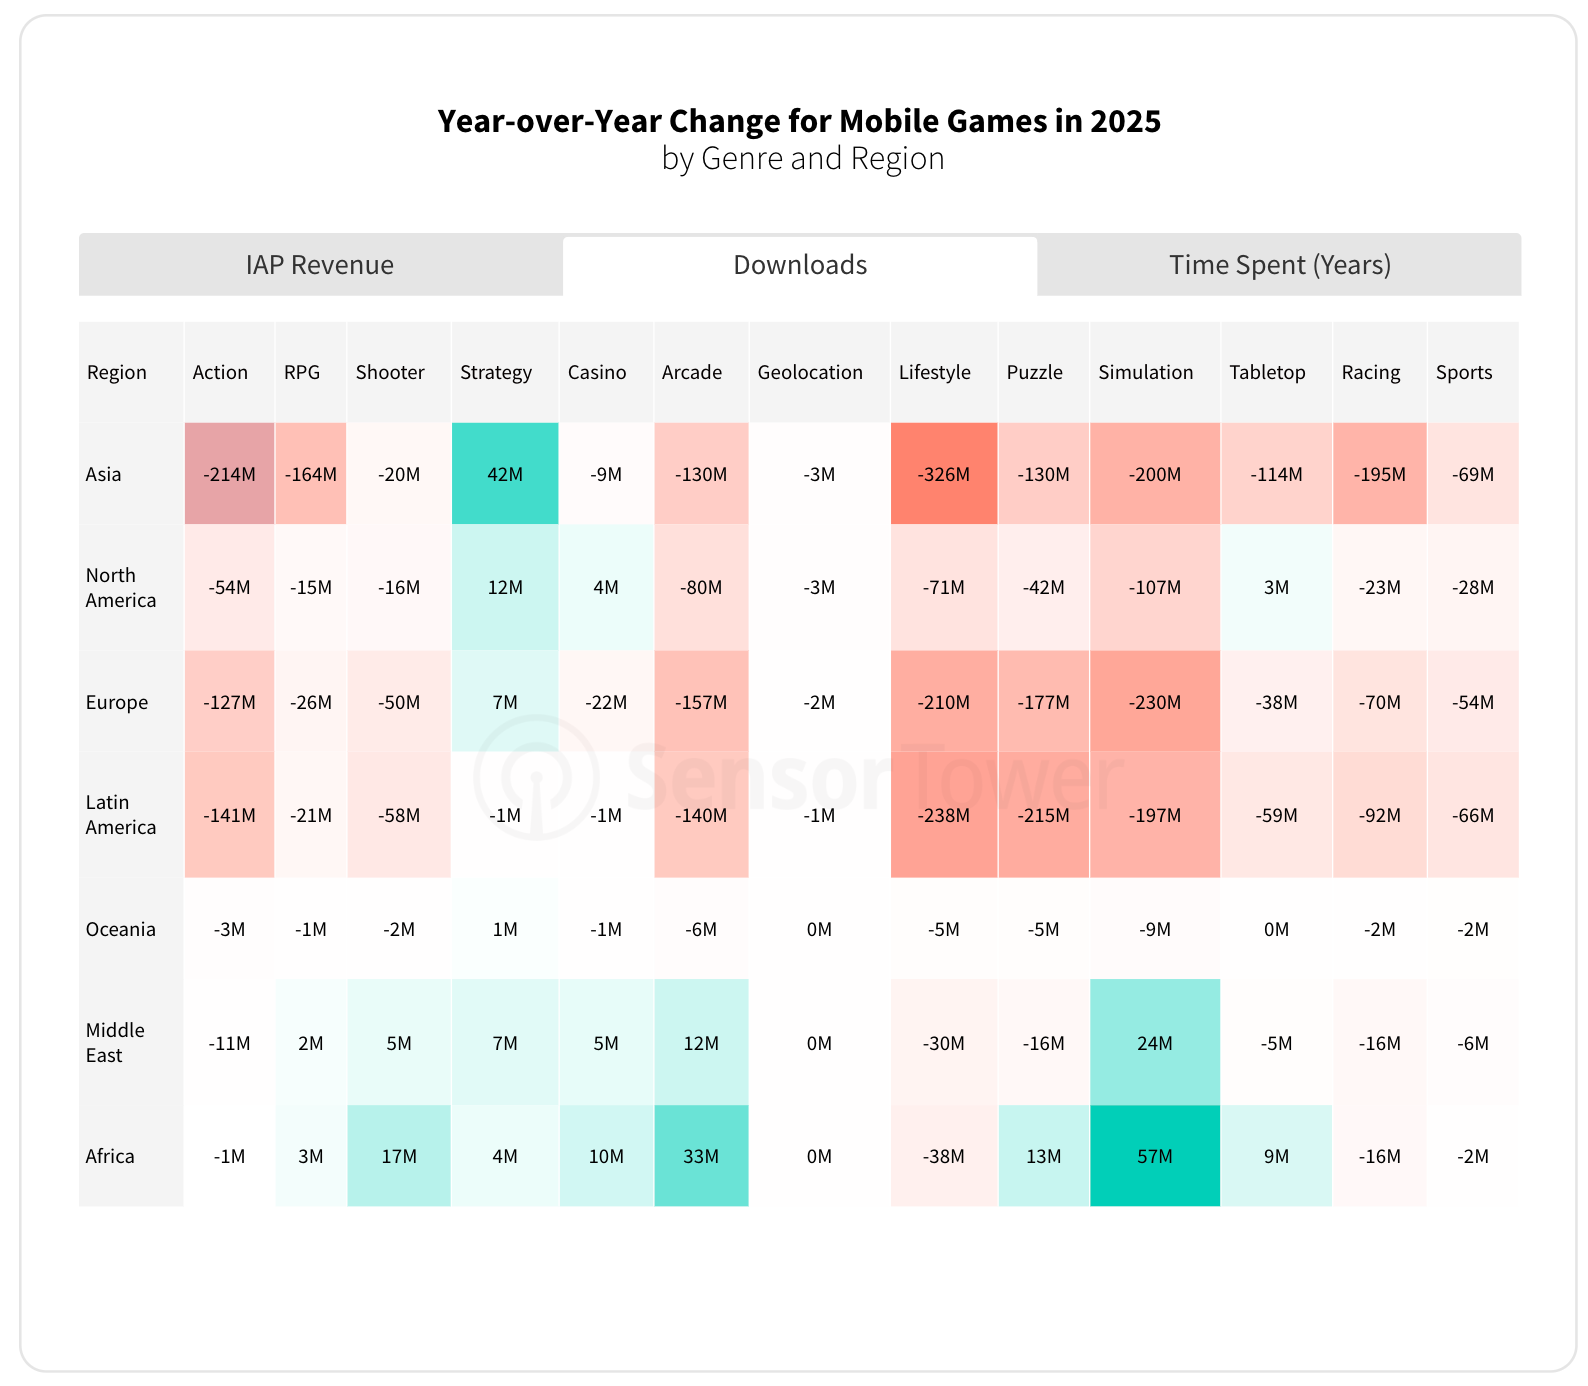
Downloads, meanwhile, keep falling. In 2025, they reached 50.41 billion (-7.2%), with the decline accelerating relative to 2024.
-
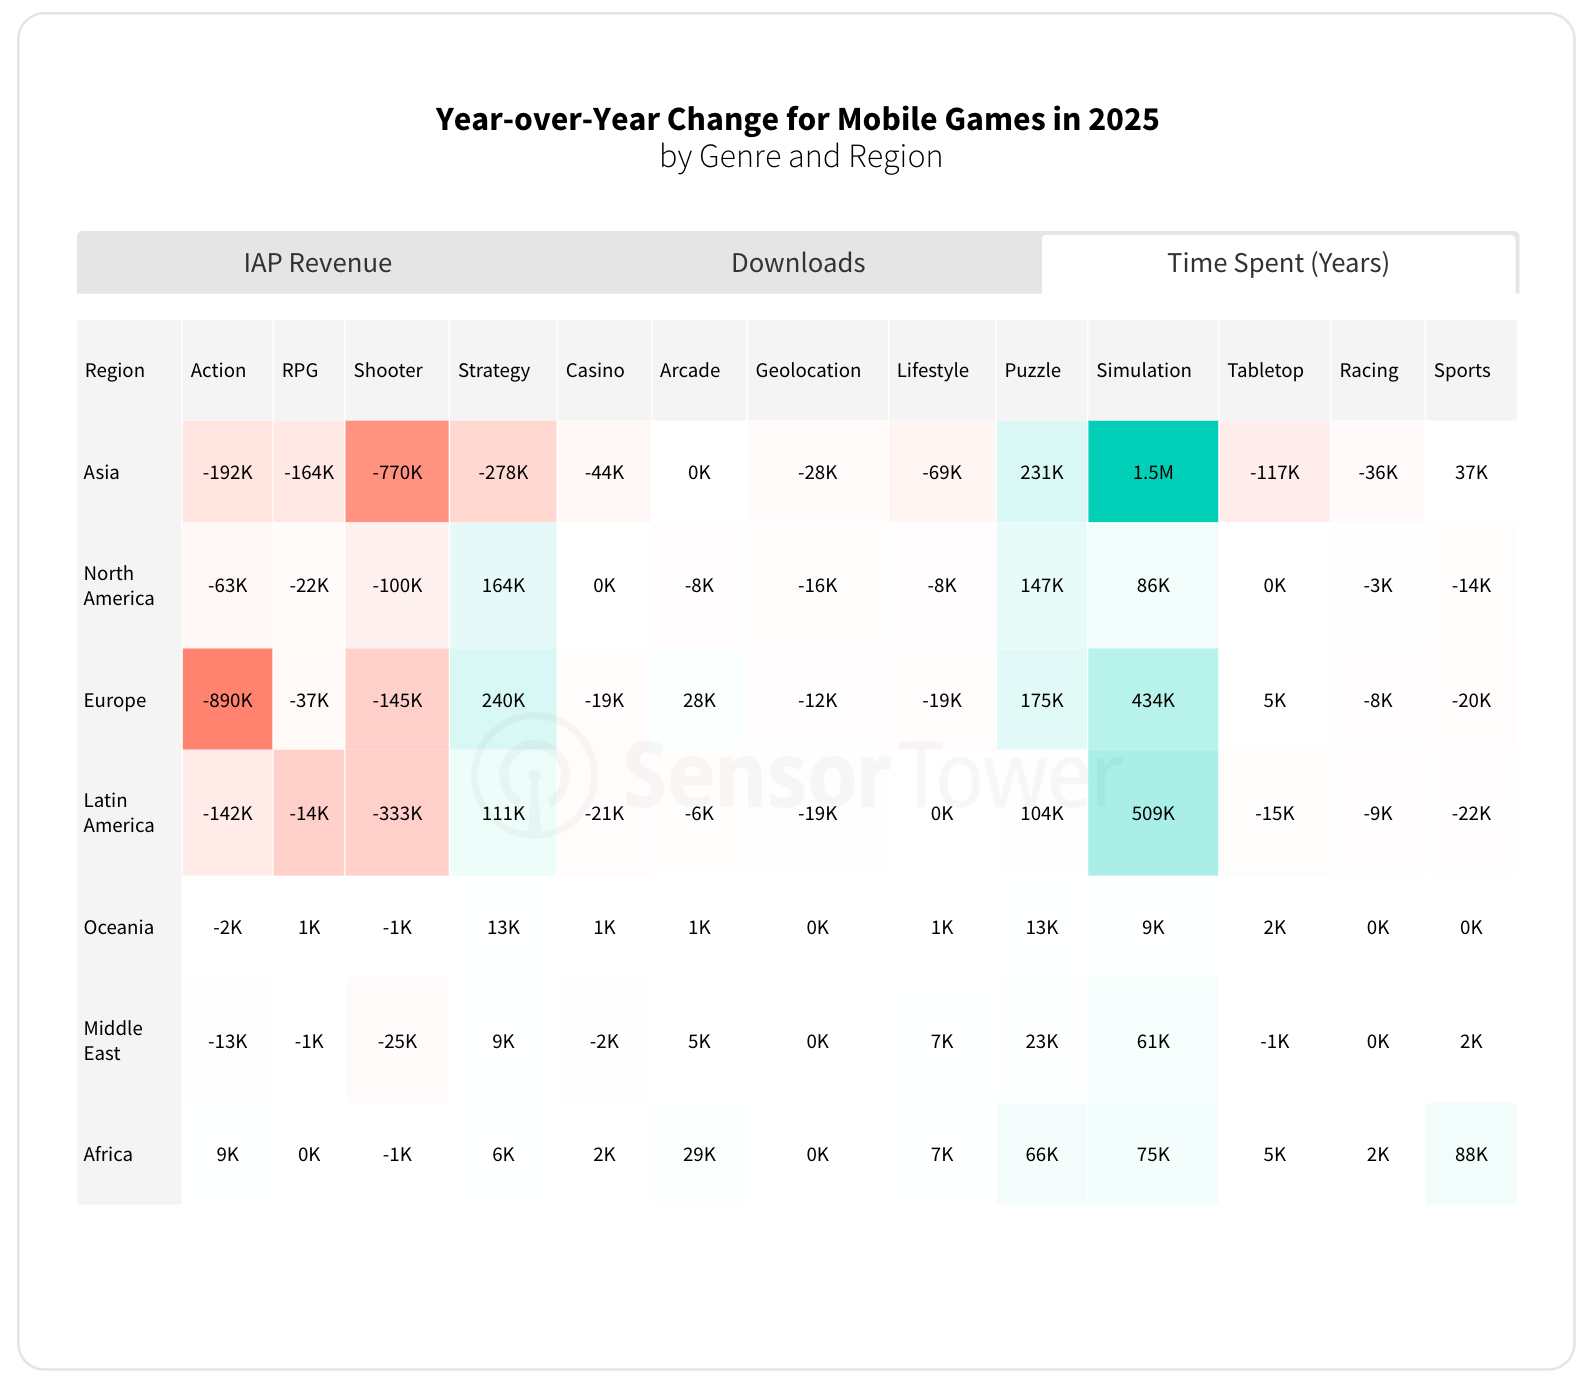
Time spent in games grew slightly (+0.9% YoY).
-
Revenue growth is uneven. Europe drove most of the gains. The US is nearly flat. Time spent in games is declining in China, though both the US and Japan saw a recovery after the 2024 dip.
-
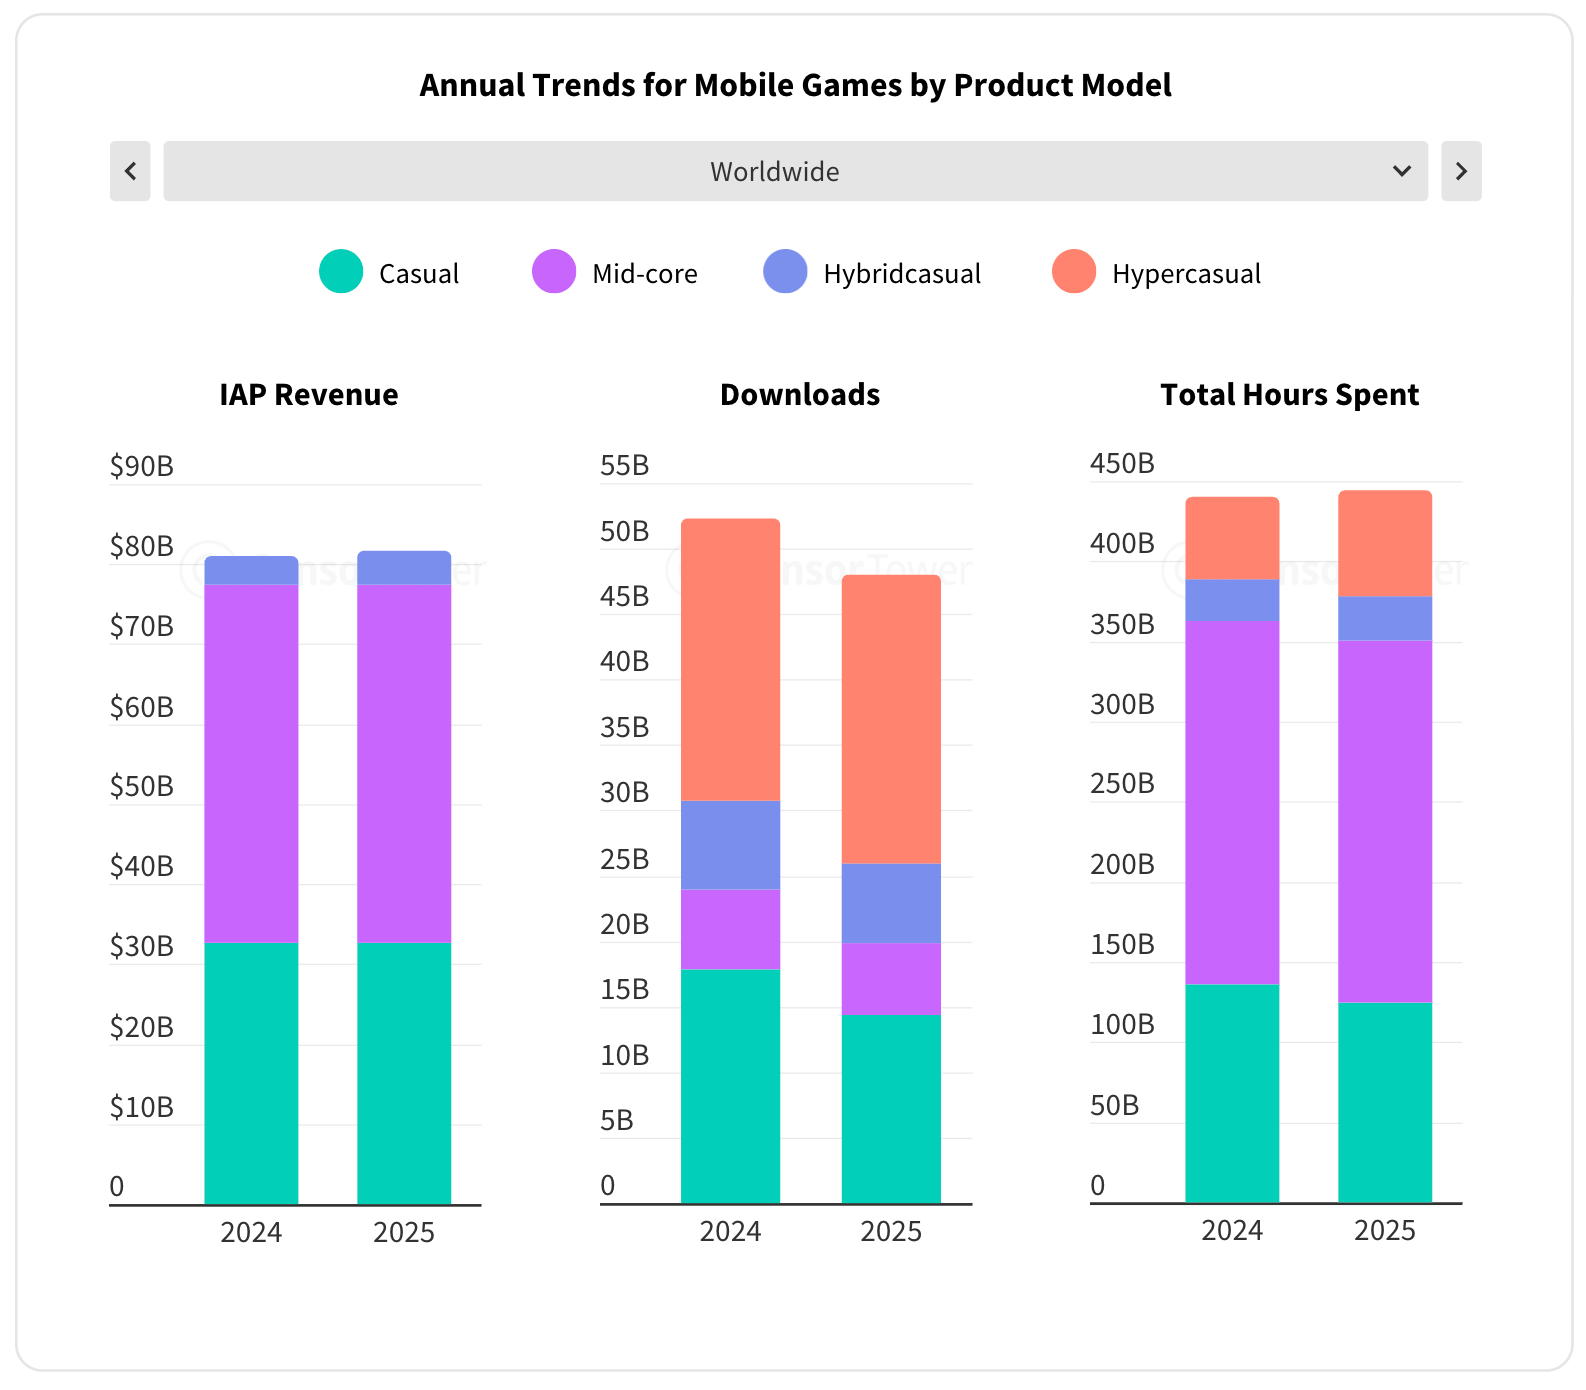
Hybrid casual is the only segment that saw meaningful IAP revenue growth (+20% YoY). Hypercasual was the only one to show any download growth at all (though modest).
-
Time spent in hypercasual games grew significantly, including in major markets like the US, Japan, and Western Europe. Sensor Tower highlights Block Blast! and Mahjong Vita as great examples.
-
Strategy and puzzle are the hottest genres of 2025 by revenue growth. Shooters are also in positive zone, especially in Asia.
-
On the downloads side, strategy is in good shape. The charts show that certain regions (the Middle East and Africa) have many genres in the positive zone; these are growing markets. Worth noting is the decline in Latin America, which has been talked up in recent years as a key driver of new user growth.


-
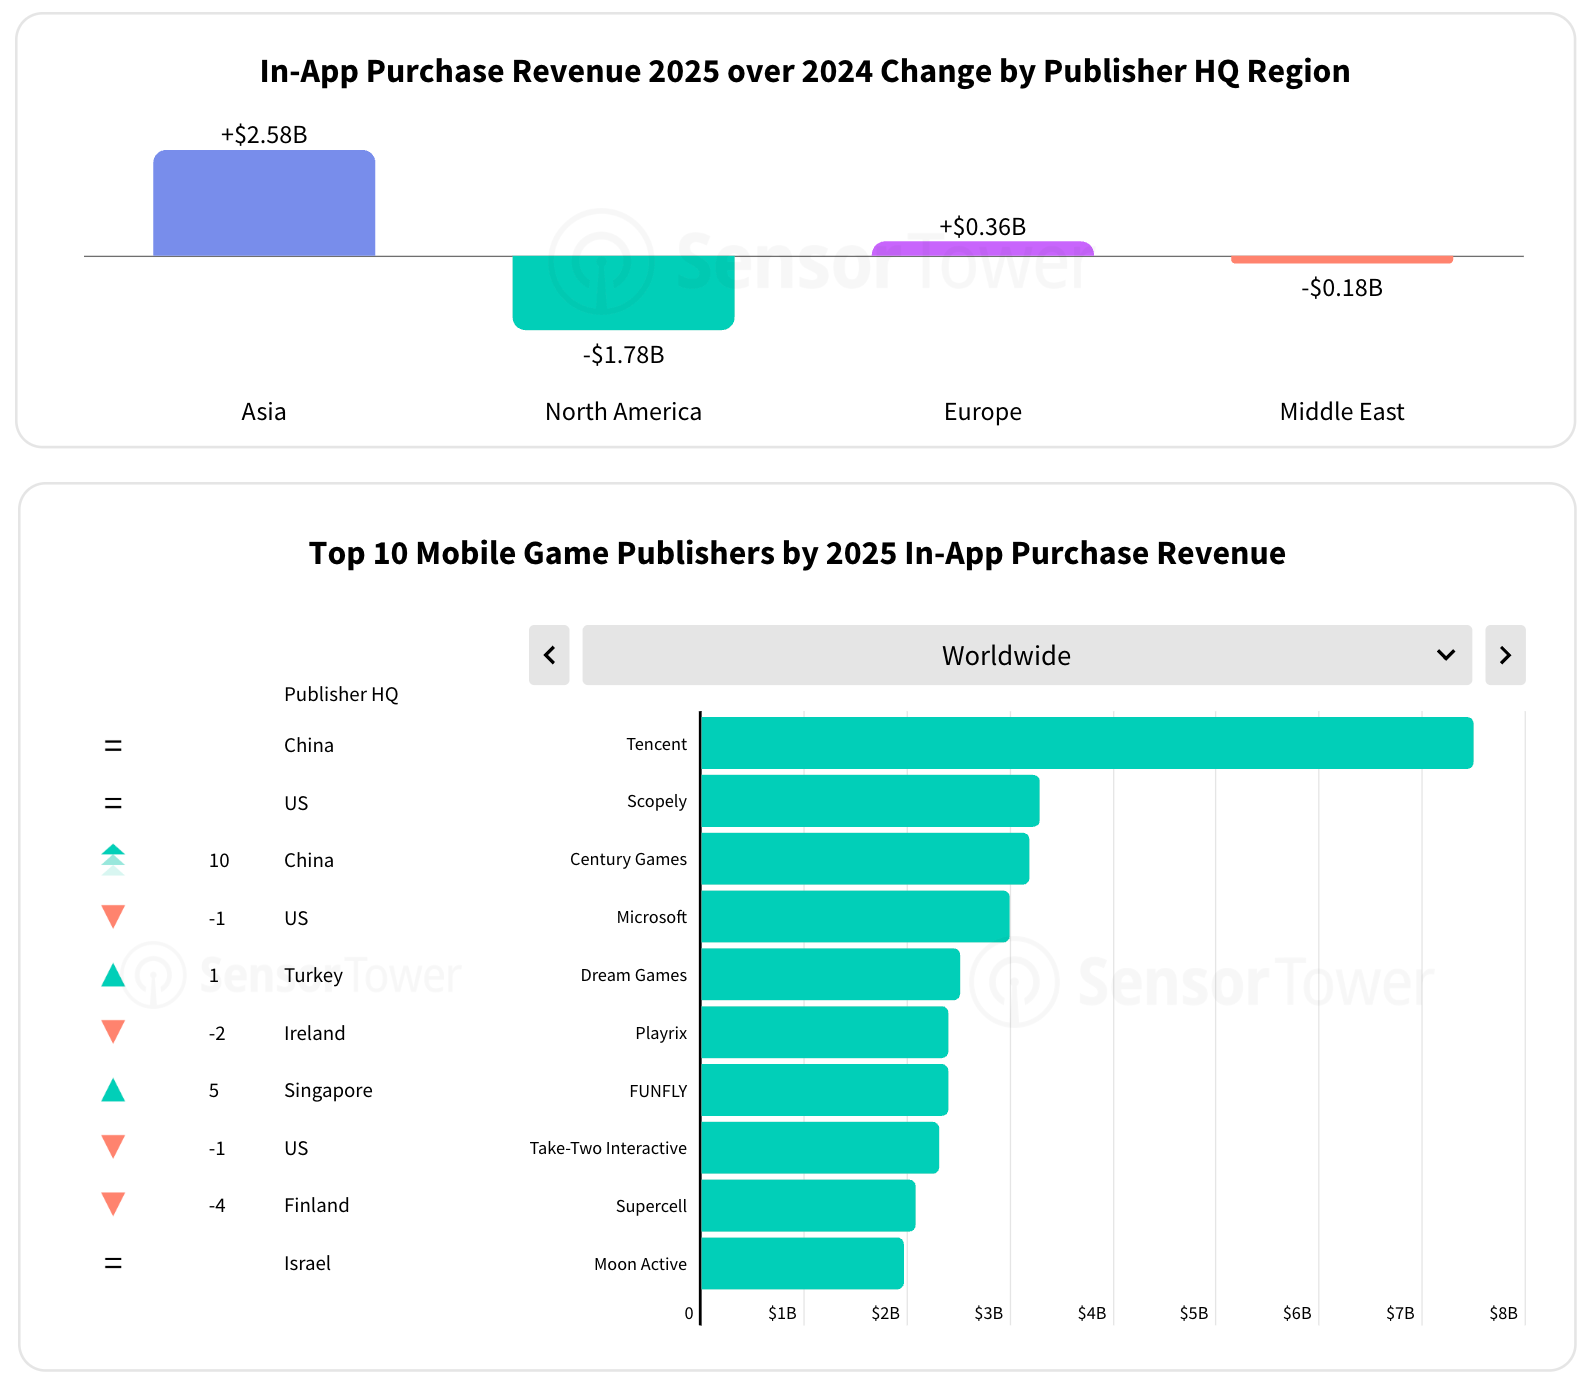
Asian studios grew IAP revenue by $2.58 billion in 2025, driven primarily by Century Games and FUNFLY. European publishers saw modest growth (+$0.36 billion YoY). North American publishers were down (-$1.78 billion YoY), as were publishers from the Middle East (-$0.18 billion YoY).
-
Tencent remains #1 in global IAP revenue, even excluding Supercell and Miniclip (counted separately in the report). Century Games burst into the top ranks, finishing the year in 3rd place and overtaking Scopely by revenue toward year’s end. FUNFLY (Last War: Survival) also made it into the top 10.


-
In major markets, the top 1,000 hybrid casual games generate most of their revenue from IAP. Brazil is an exception: the IAP share there is significantly lower.
-
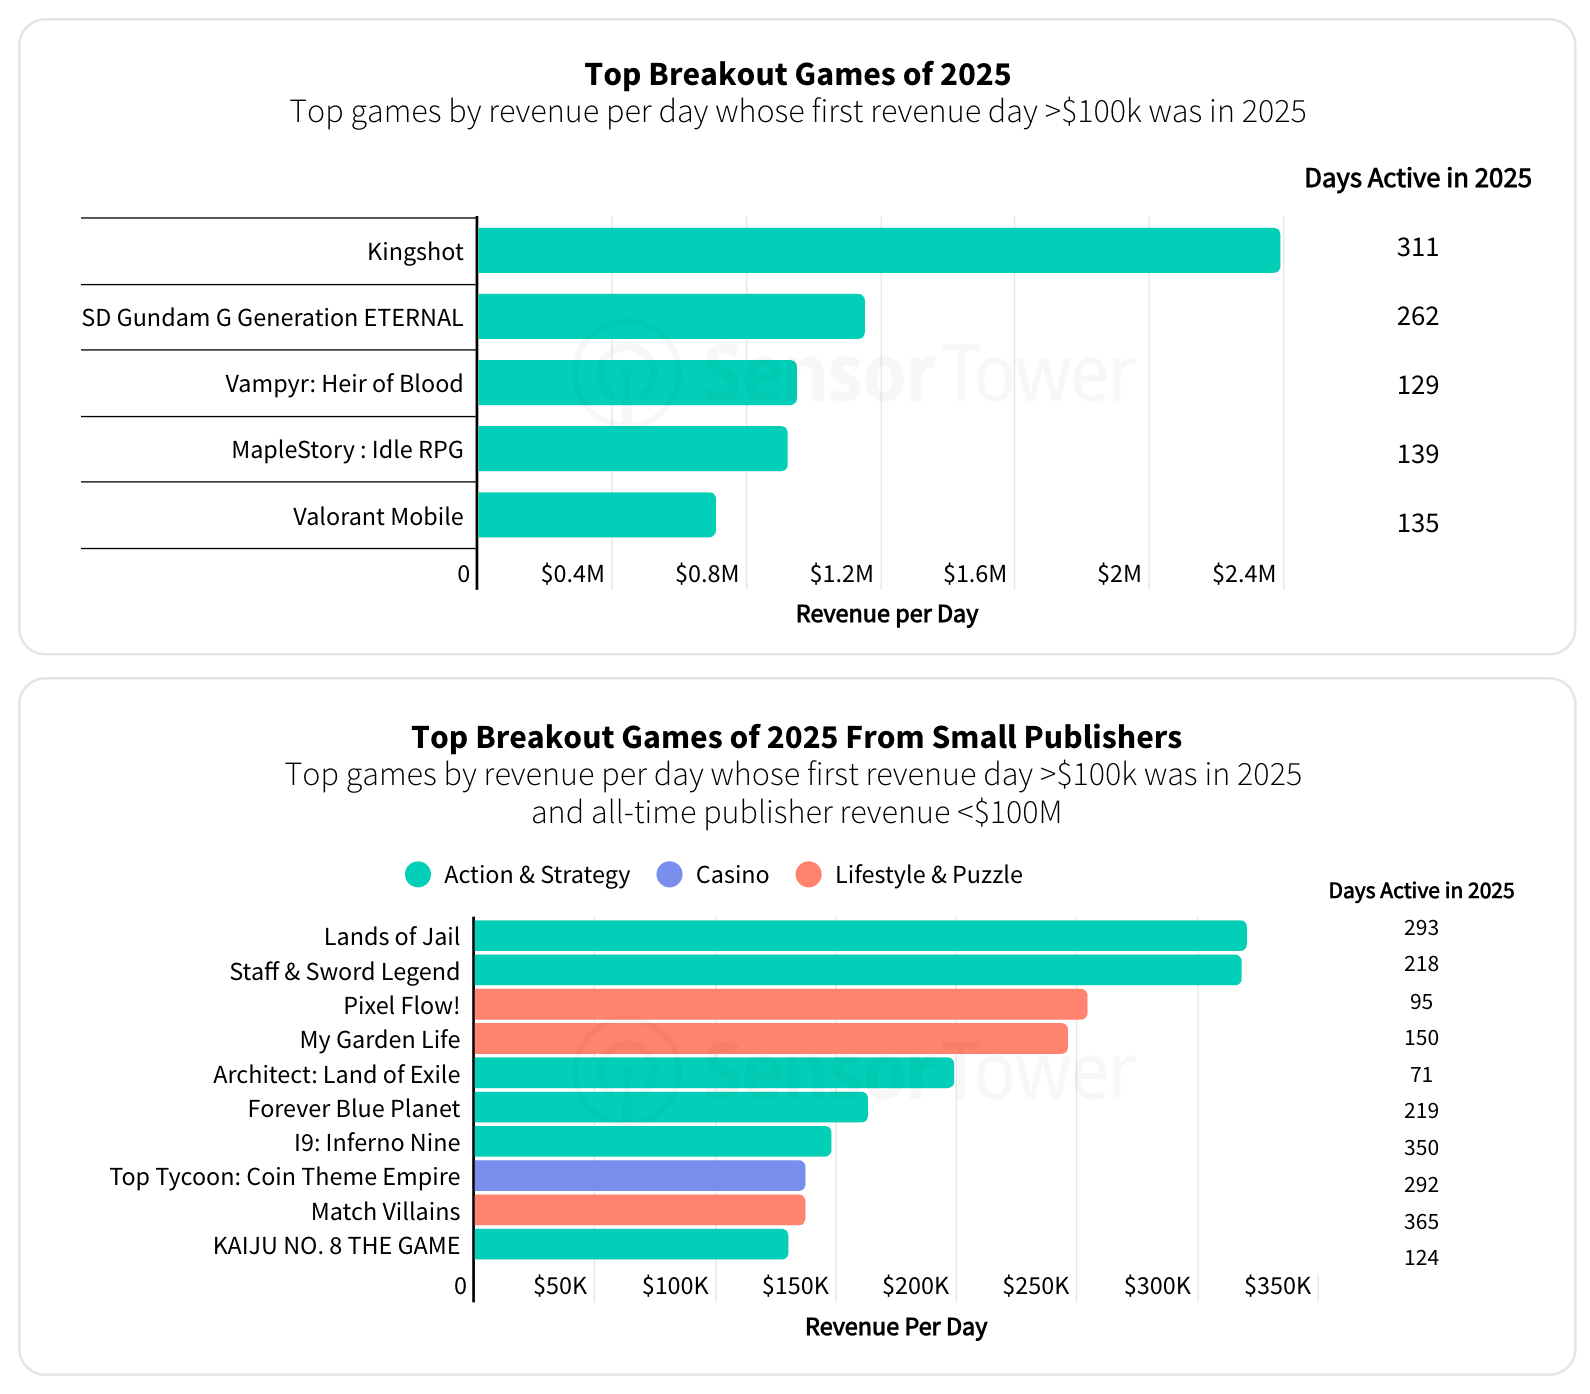
The biggest launch of 2025 among large studios was Kingshot by Century Games, which reached #7 globally by IAP revenue by December 2025. SD Gundam G Generation ETERNAL was second on the launch list, though it earns primarily in Japan. Valorant Mobile, after its China launch in December, jumped to #6 by IAP revenue.
-
Among smaller studio launches, Pixel Flow! deserves a mention: its developer was acquired by Scopely in February 2026 for a reported $1 billion valuation. Interestingly, the game itself didn’t top the rankings.
-
Tencent has the largest portfolio of IP by mobile revenue in 2025, with Honor of Kings and League of Legends as its two biggest titles. Though Monopoly still sits at #1 overall in the IP rankings.
-
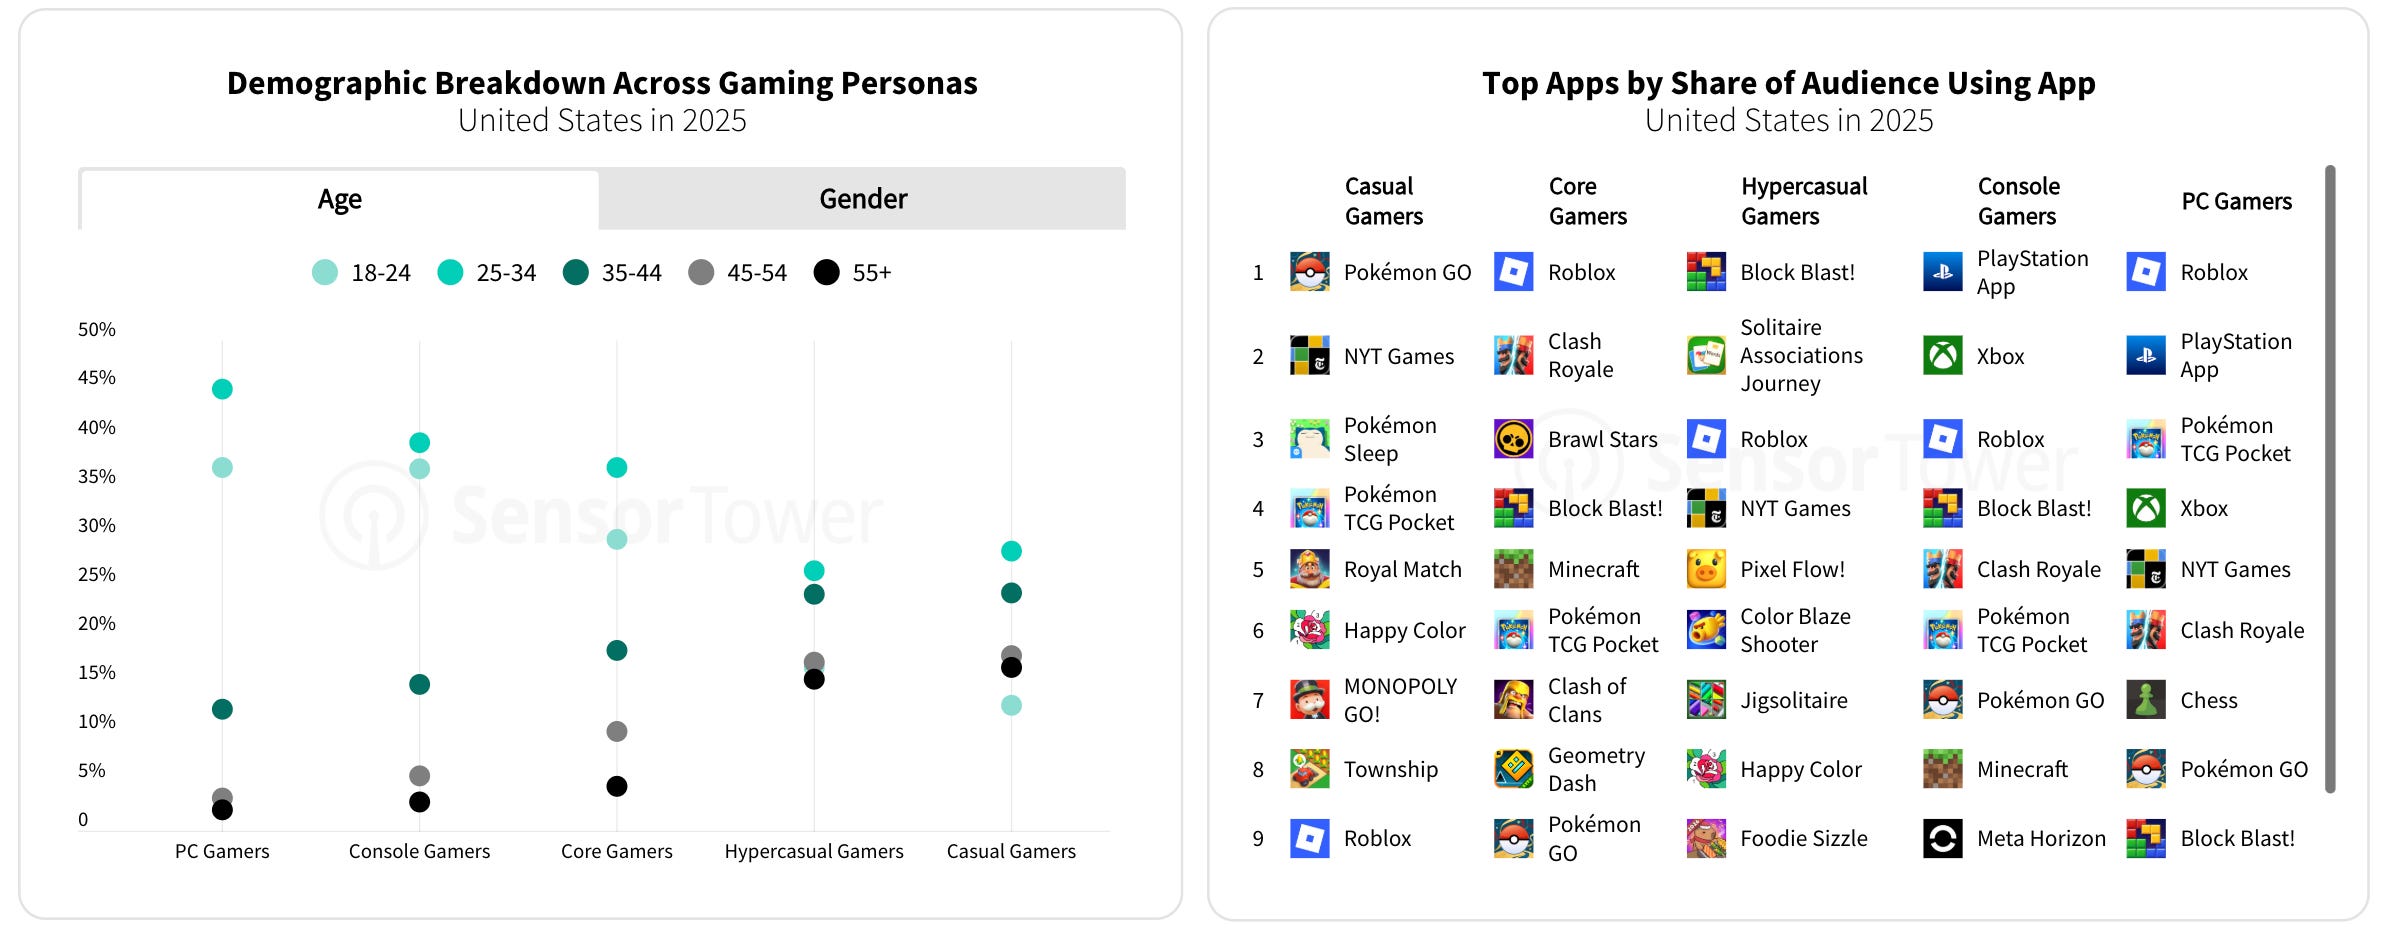
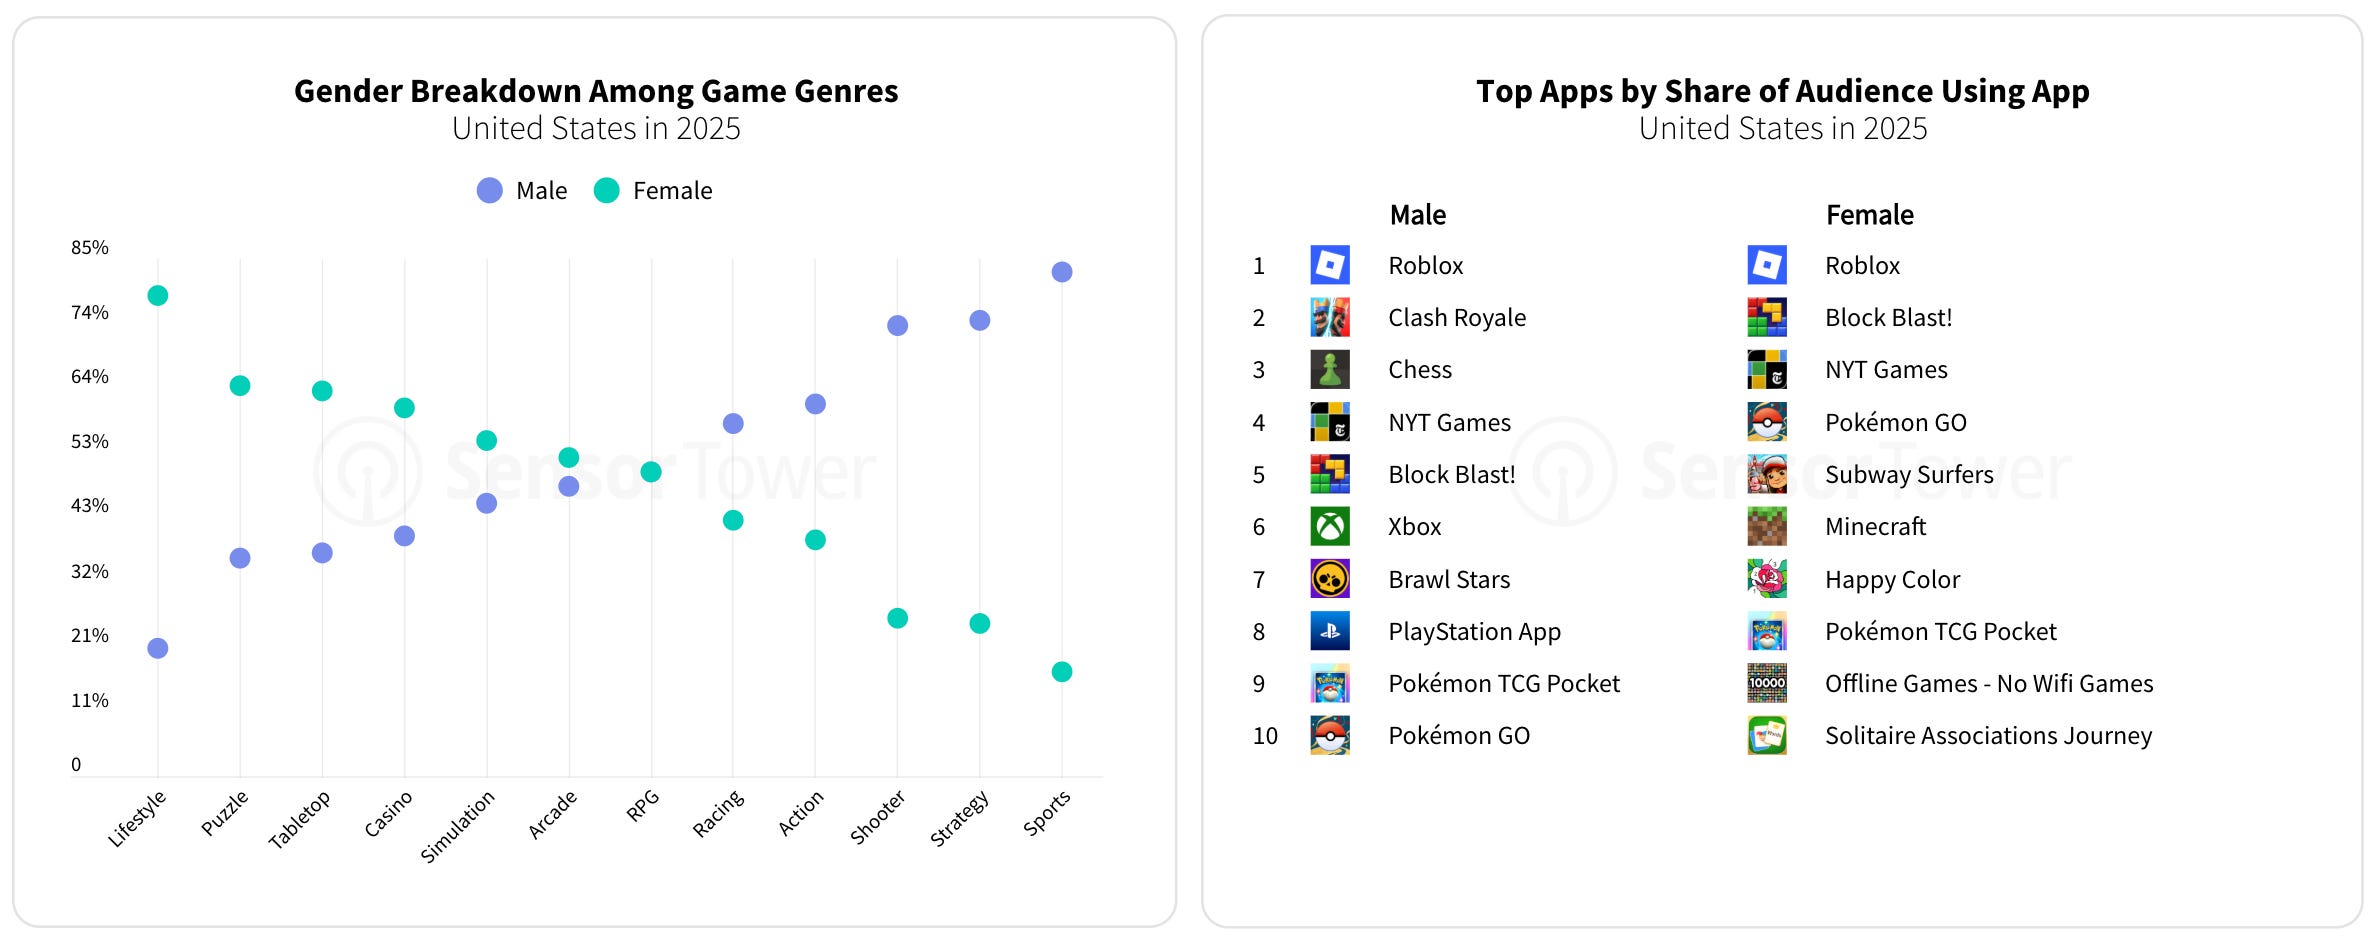
Some mobile genres show strong gender skews. In the US, women make up a larger share of players in lifestyle games, puzzles, and casinos. Male players dominate sports games, strategy, and shooters, with significant gaps across these genres.
-
In 2025, the number of monetization-focused live ops events declined slightly, while events tied to progression and social mechanics increased.
❗️I think it would be helpful to have a genre-level breakdown here.


-
This appears to be the first time Sensor Tower has highlighted the effectiveness of live ops mechanics in its reports. A note on methodology: a revenue spike is defined as 5% growth relative to the same day of the previous week. The trend is considered active as long as each day is at least 5% higher than the corresponding day the following week. For longer events, the first and last weeks are compared.
-
The most reliable mechanic by Revenue Spike Success Rate (the likelihood that deploying the mechanic leads to a revenue uplift) is the event menu (83.4%), followed by expeditions (#2) and various battle passes (#3).
-
Sensor Tower (together with Playliner, now part of ST) tracked several trends in detail, highlighting the growing popularity of Merge mechanics in Match games and increased activity around web shop advertising.


❗️Sensor Tower is showing a positive effect of web shop advertising on App Store and Google Play revenue. The effect should be the opposite. Yet ST reports a positive outcome in more than 50% of cases.
-
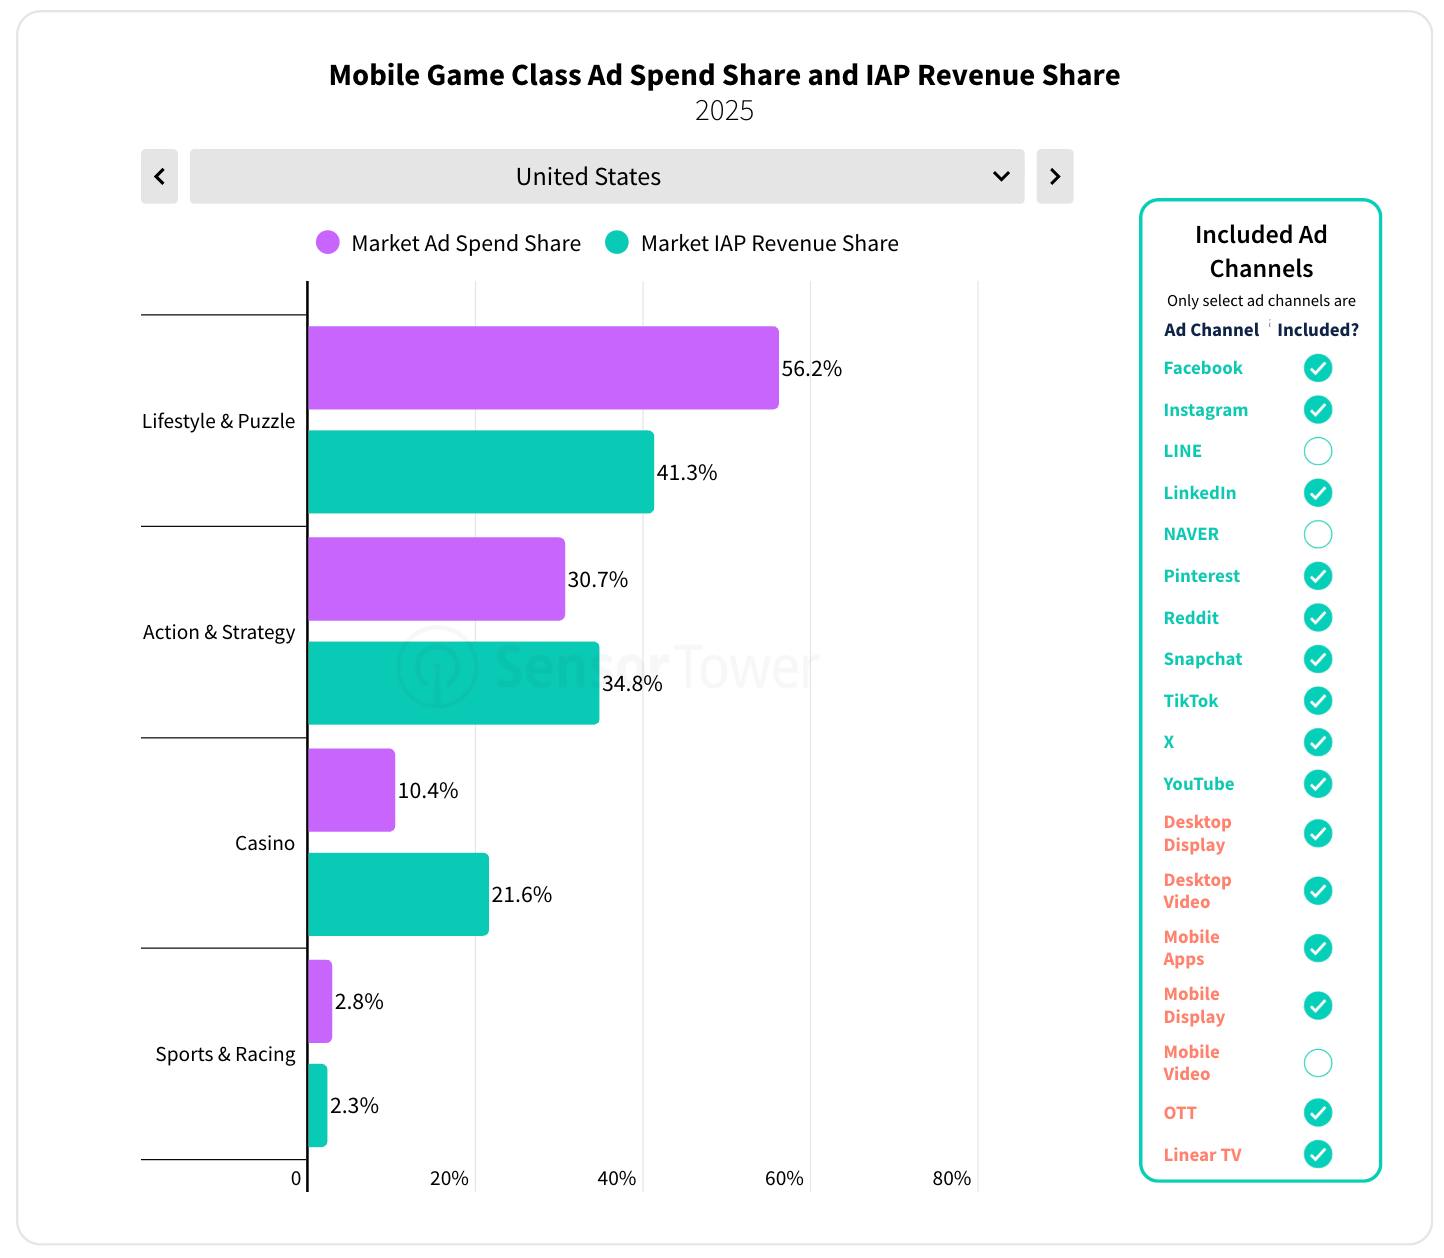
In the Lifestyle and Puzzle segments, marketing ad spend share exceeds the IAP revenue share in almost every market. The competition in these genres is fierce. For the casino, it seems reversed (but I know the competition there is not easy either).
-
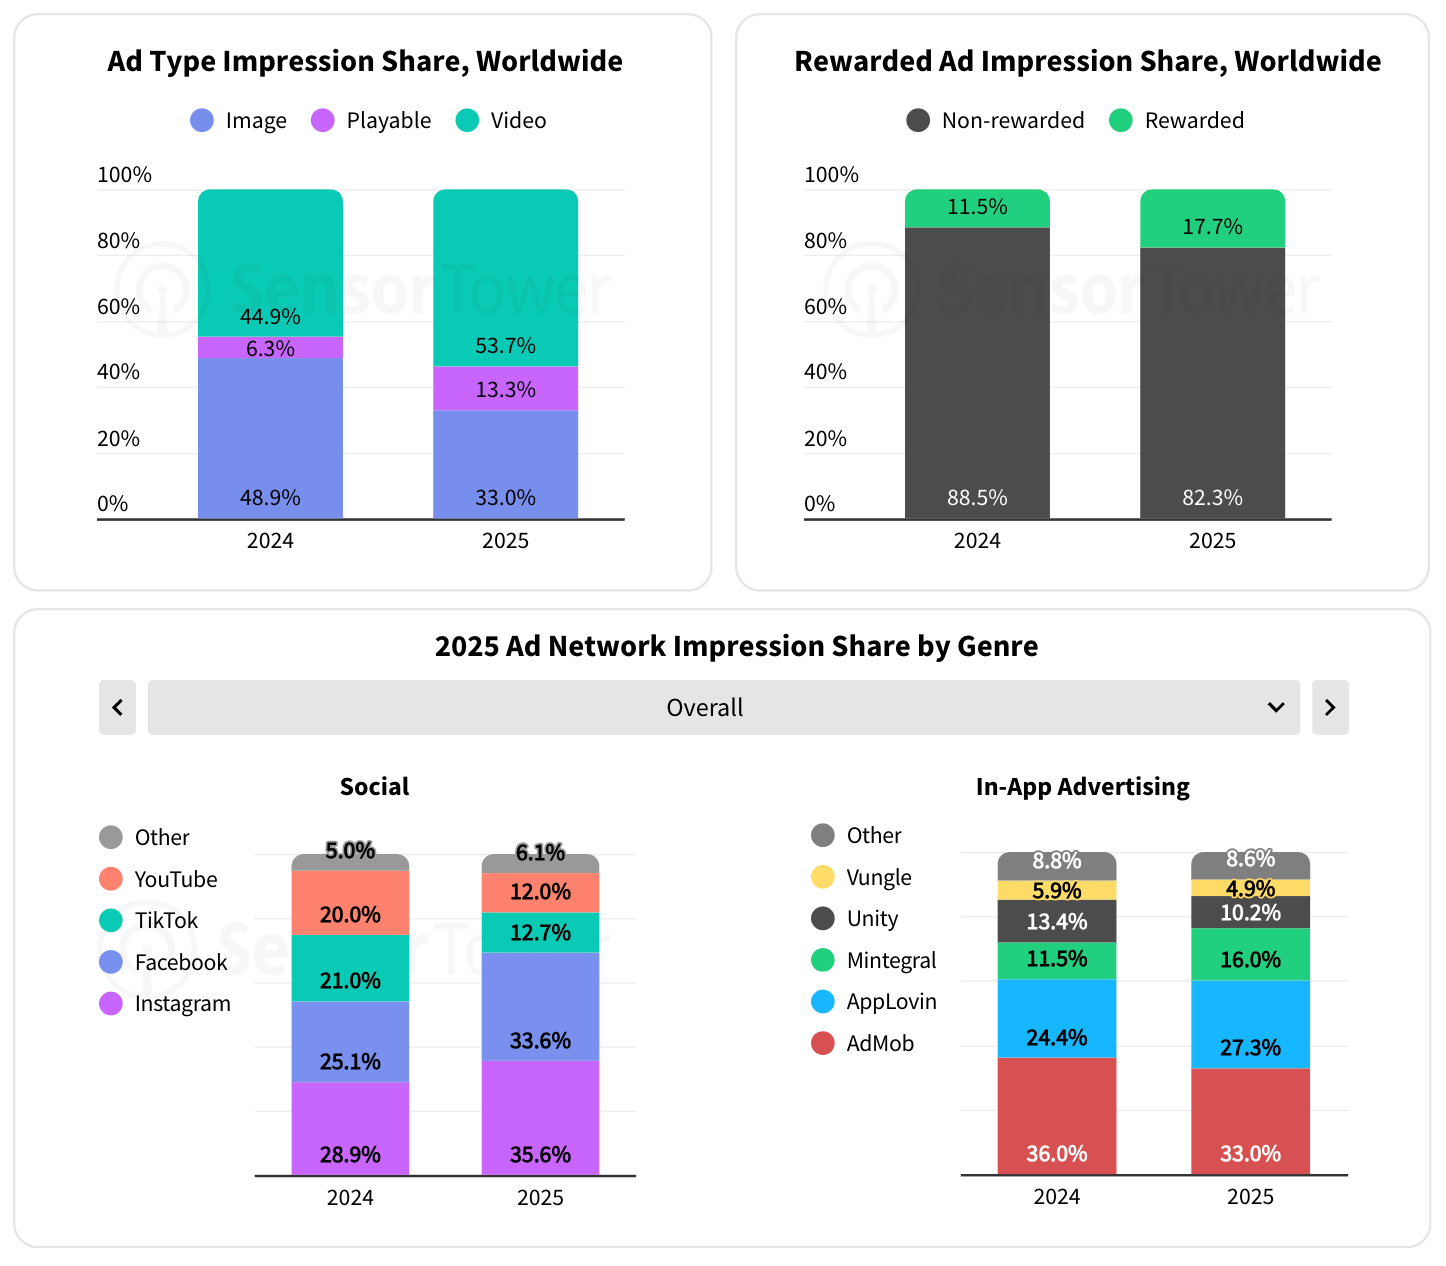
The share of video creatives grew to 53.7% (from 44.9% last year). Playables reached 13.3%, nearly doubling.
-
Rewarded ads reached 17.7% of all impressions (+53.9% YoY).
-
Among ad networks, AdMob leads (33% in 2025, down from 2024), followed by AppLovin (27.3% of all spend, growing) and Mintegral (16%, the strongest growth versus 2024). Unity and Vungle are both losing their positions slightly.
-
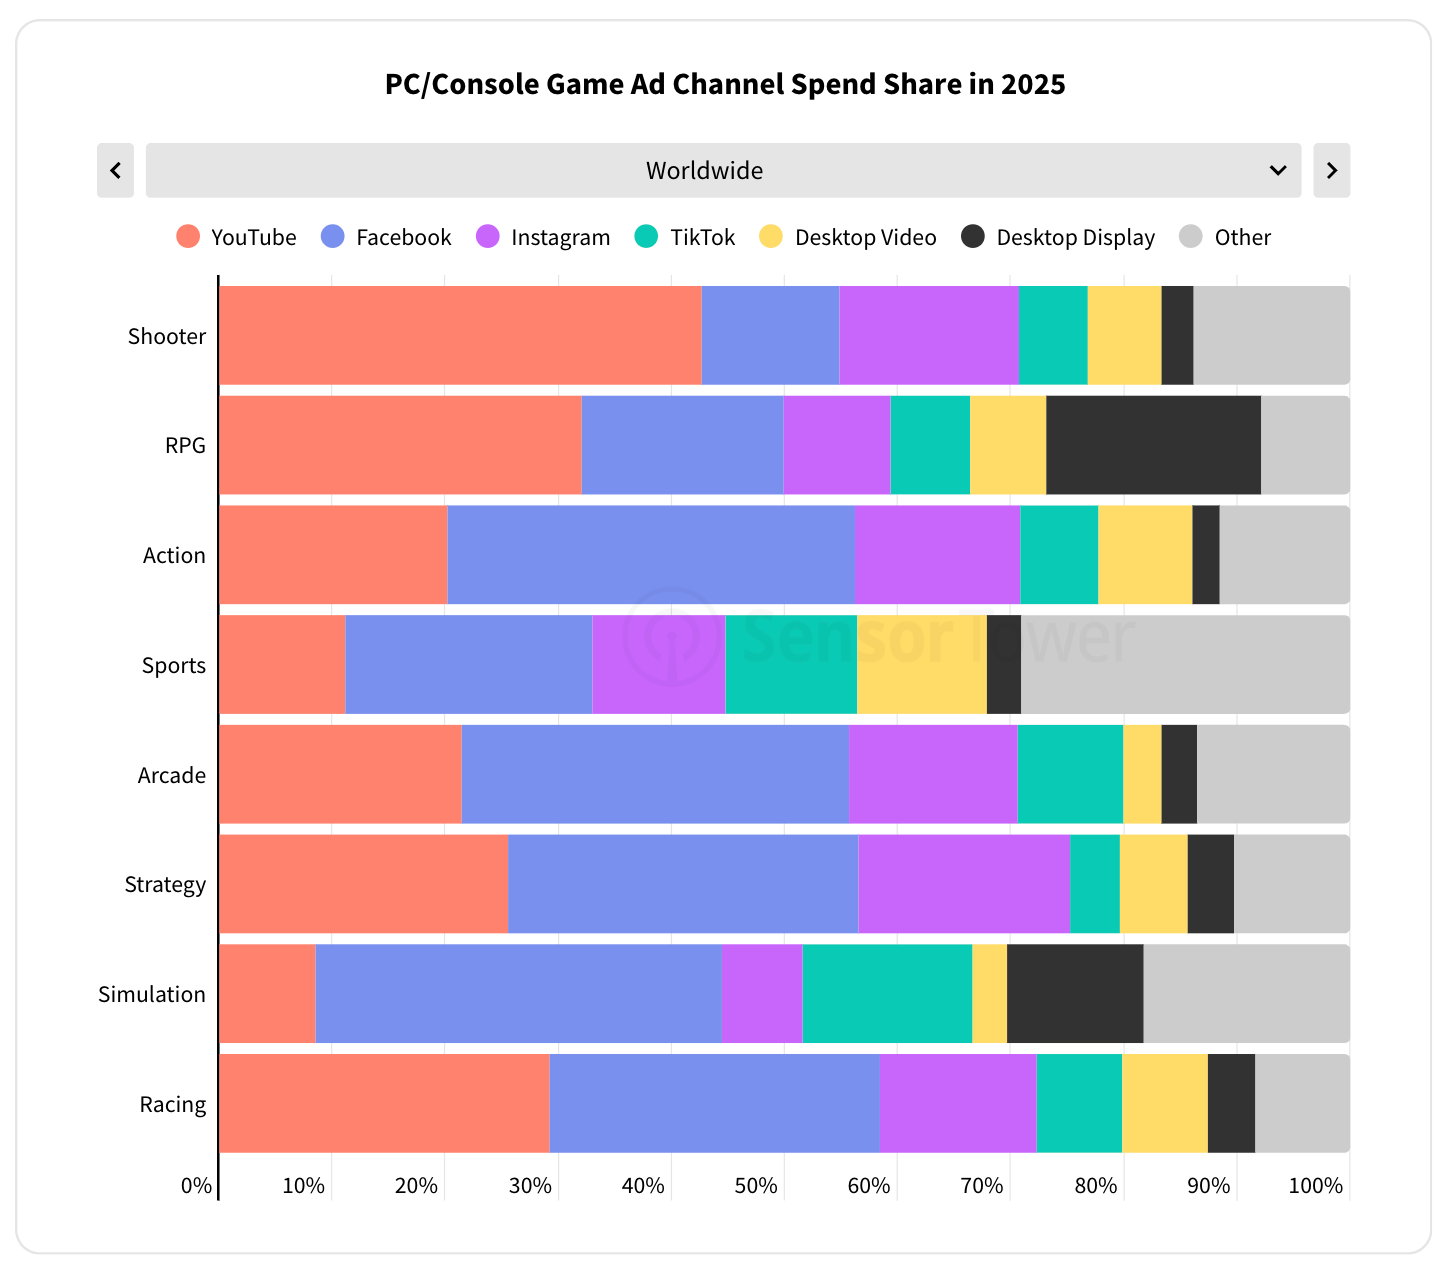
In social channels for mobile advertising, Meta continues to dominate. Instagram (35.6%) and Facebook (33.6%) strengthened their lead. TikTok, however, decreased to 12.7%, nearly half of last year’s share. YouTube also declined to 12%. The picture is reversed in the PC/console segment, where YouTube remains the clear leader.
-
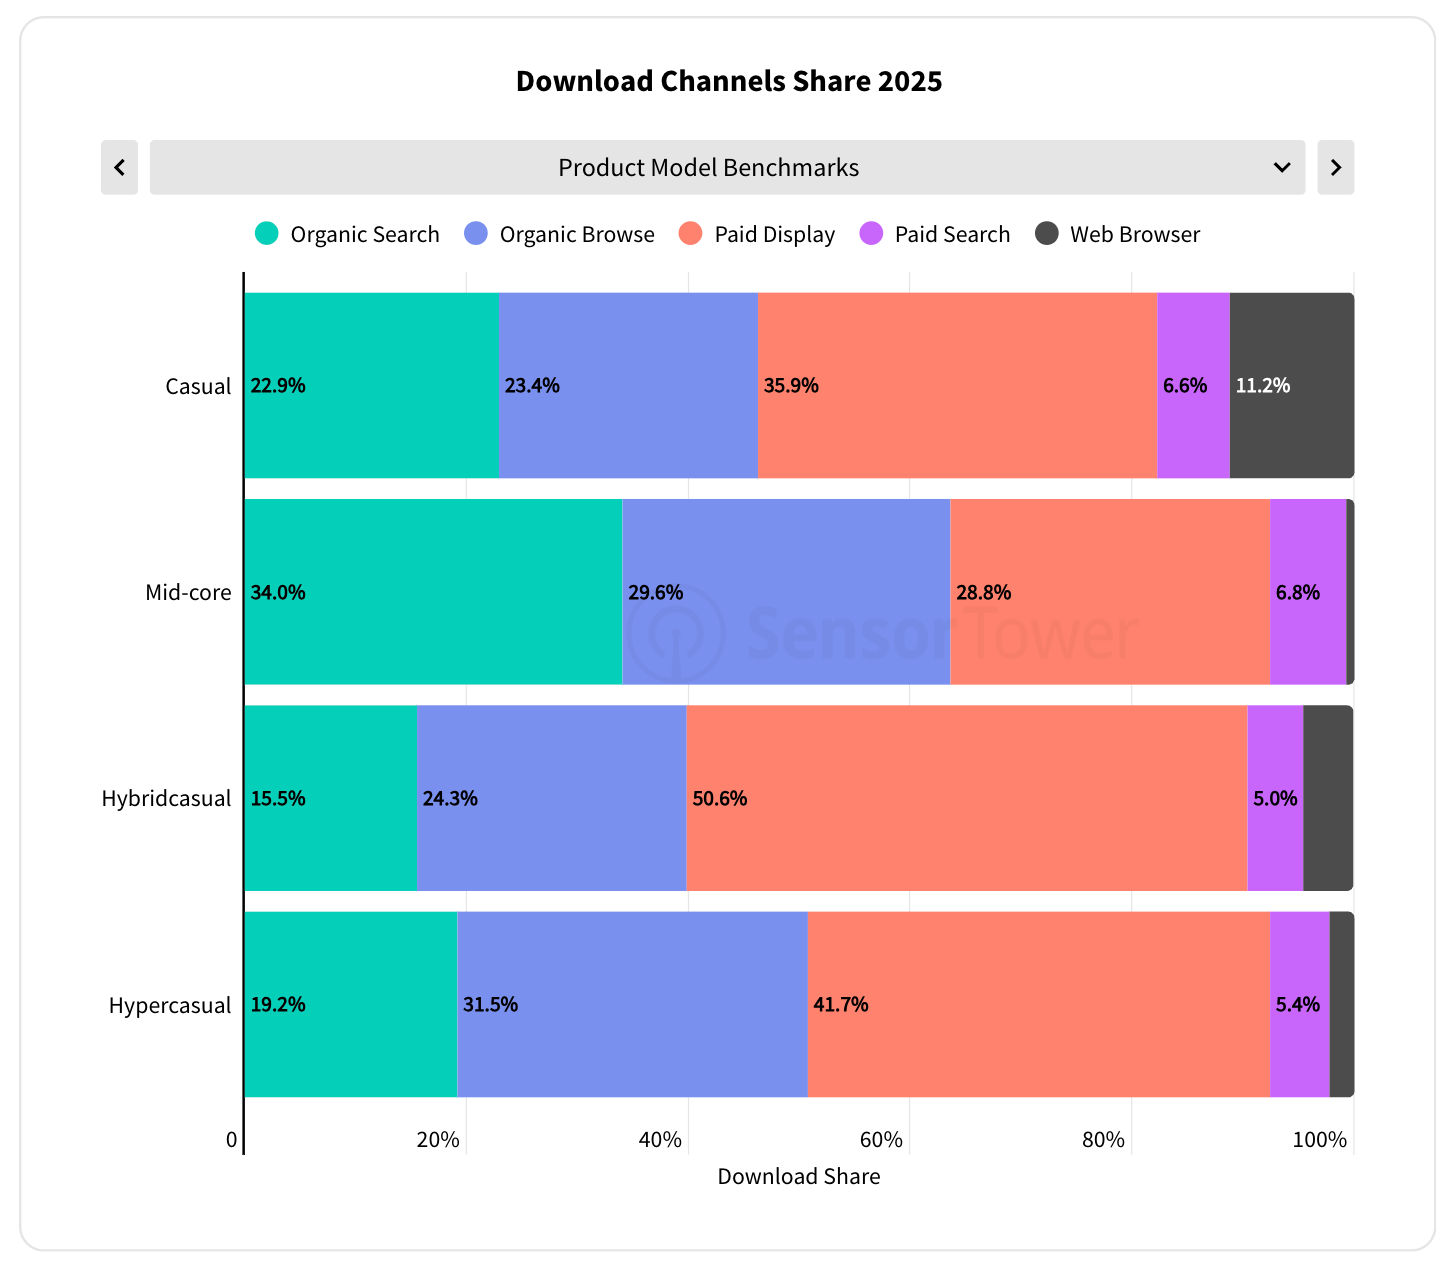
For the first time, Sensor Tower is showing benchmarks on download channel distribution. Hypercasual games have the highest share of paid traffic (50.6%), while midcore has the lowest (28.8%).
-
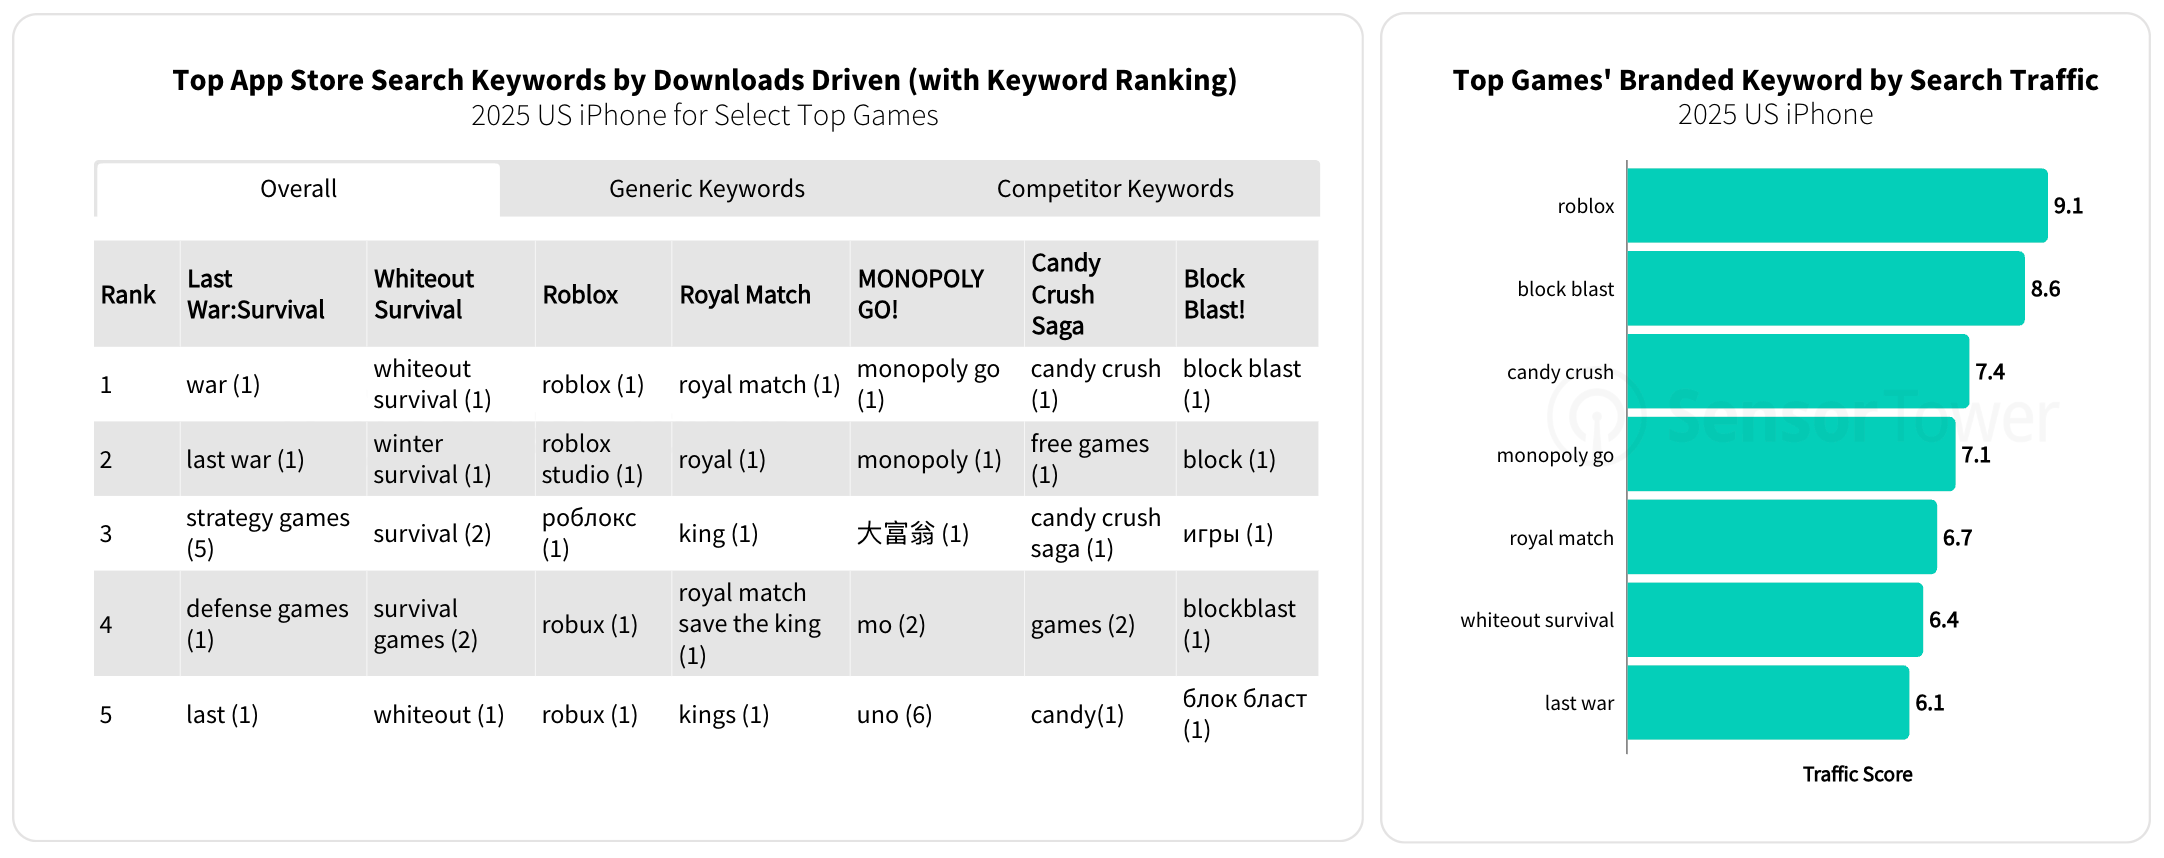
Roblox has one of the strongest brand search scores among all apps: traffic score 9.1, comparable to Google (8.9) and TikTok (9.5). Block Blast! sits at 8.6, Candy Crush Saga at 7.4.
-
Games were downloaded over 52 billion times in 2025, with more than 50 billion of those coming from mobile devices.
-
Google Play accounts for 81% of all installs, App Store for 15%, and all PC platforms and consoles combined make up just 4%.
-
In terms of revenue growth, the App Store nearly plateaued in 2025, growing just 0.6% to $52.5 billion. Google Play grew 2.8% to $30 billion. Steam, on the other hand, was up 13% to $11.7 billion.
-
Downloads are declining on both the App Store (-5.7% YoY, 7.8 billion installs) and Google Play (-7.3% YoY, 42.4 billion installs). Steam showed growth (+6% YoY), but its base is nowhere near mobile (857 million installs in 2025).
-
The number of games released is growing on every platform. App Store reached 55,300 titles (+11.4% YoY), Google Play saw over 150,000 games (+45.9% YoY), and Steam hit 20,000 (+8.4% YoY).
-
On mobile in 2025, the strongest growth came from strategy ($20.2 billion) and puzzle ($14.4 billion). On Steam, action ($3.88 billion) and shooters ($1.77 billion) led the way. RPG remains one of the largest segments on both mobile and Steam, but is in decline on both.
-
In terms of marketing spend, mobile games allocate most of their budgets to in-app advertising (which makes sense). PC/console games, on the other hand, invest heavily in YouTube and social media: Facebook, Instagram, and TikTok.
-
By revenue, the leaders are Monopoly, Pokémon, and FIFPro (which covers all mobile projects with football licenses).
-
According to Sensor Tower, among cross-platform publishers, Embracer Group leads downloads in 2025. Though these numbers feel odd: by the end of 2025, the company’s only mobile division was DECA Games, as Easybrain had been acquired by Miniclip (Tencent). I’m not sure of the validity of this particular chart.
-
Roblox topped all gaming websites, web shops, and platforms in popularity. The scale just makes the charts hard to read.
A word from our sponsor
Boost your game’s revenue with Xsolla’s Buy Button, enabling secure 1-tap purchases via Apple Pay, Google Pay, and saved cards. Leverage Apple’s 2025 update allowing external purchase links in the U.S. to reduce platform fees and increase control over monetization. Sync offers in-game events via API, driving player retention with dynamic bonuses, discounts, and loyalty rewards – all in a seamless, familiar payment flow that maximizes conversions.
-
By downloads, action games were the top genre in 2025. Shooters were second, RPGs third. The trend holds across all platforms.
-
The charts clearly show how different the indie developer share of downloads looks on Steam versus PlayStation & Xbox.
-
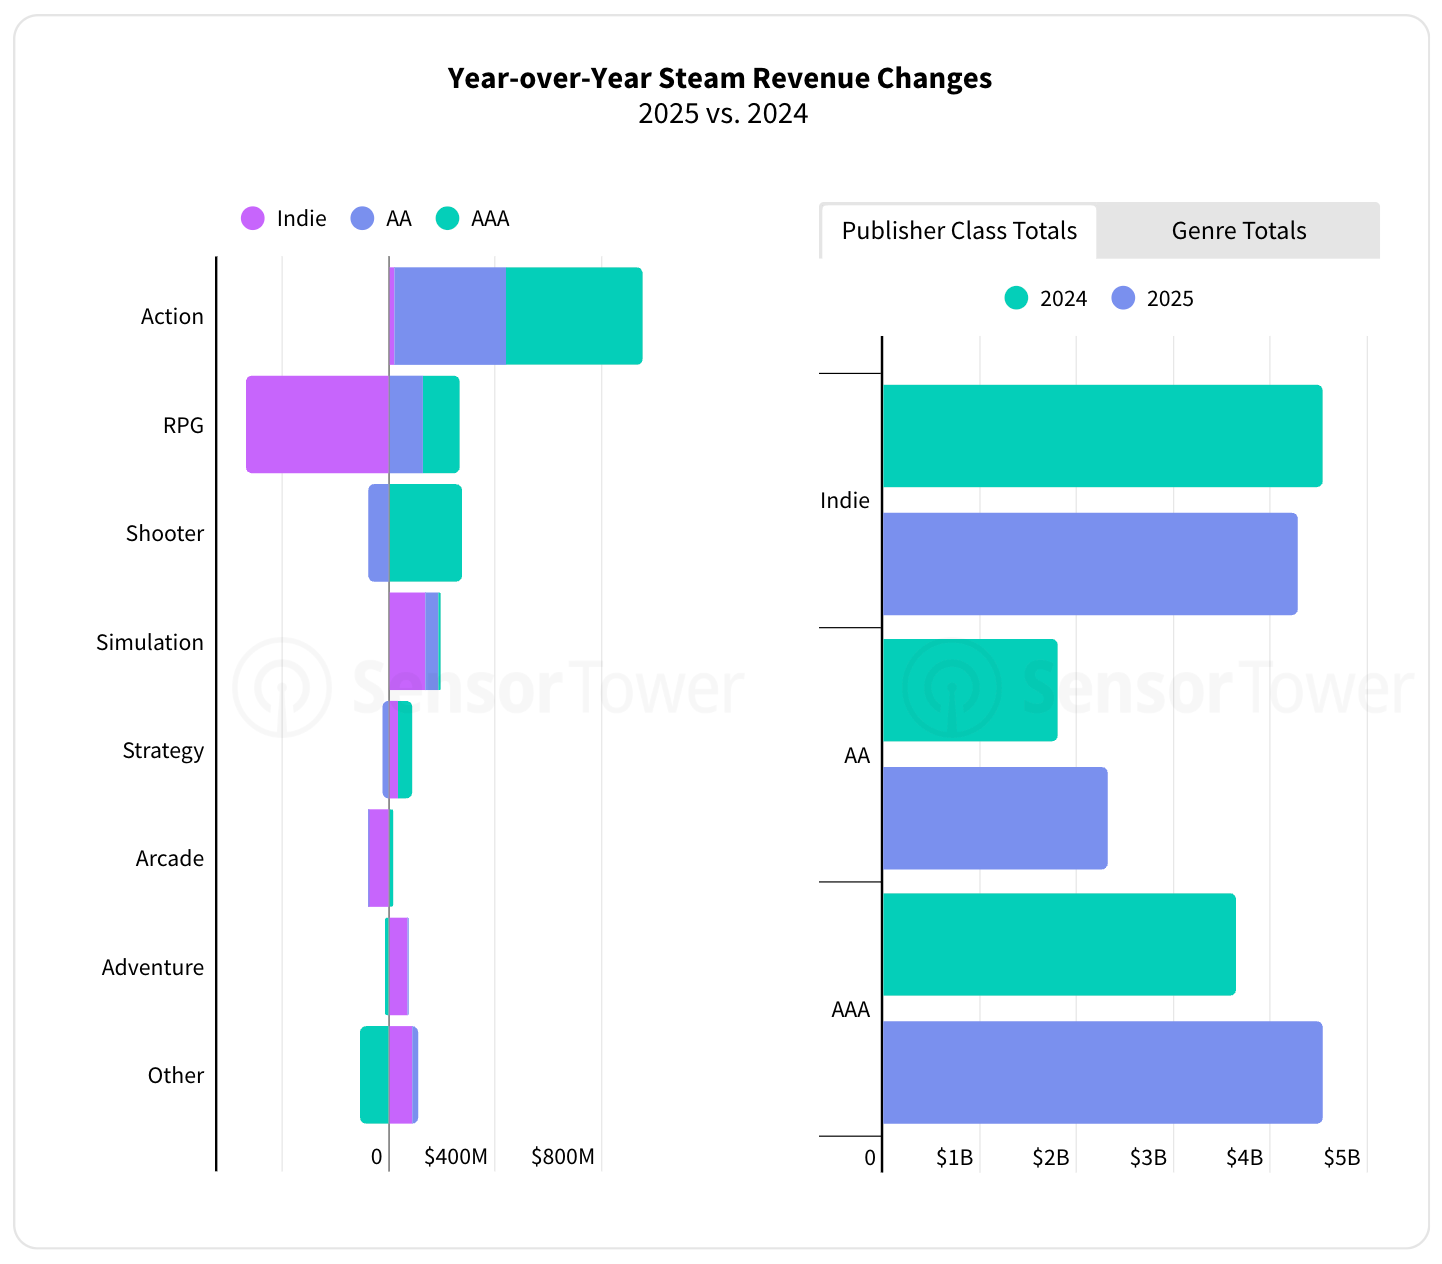
2025 was a strong year for Steam across all key metrics. Contrary to the prevailing narrative, indie game sales on Steam actually declined in 2025. This is largely because Black Myth: Wukong was classified as an indie title in 2024, and indie revenue had already grown 77% YoY in 2023.
-
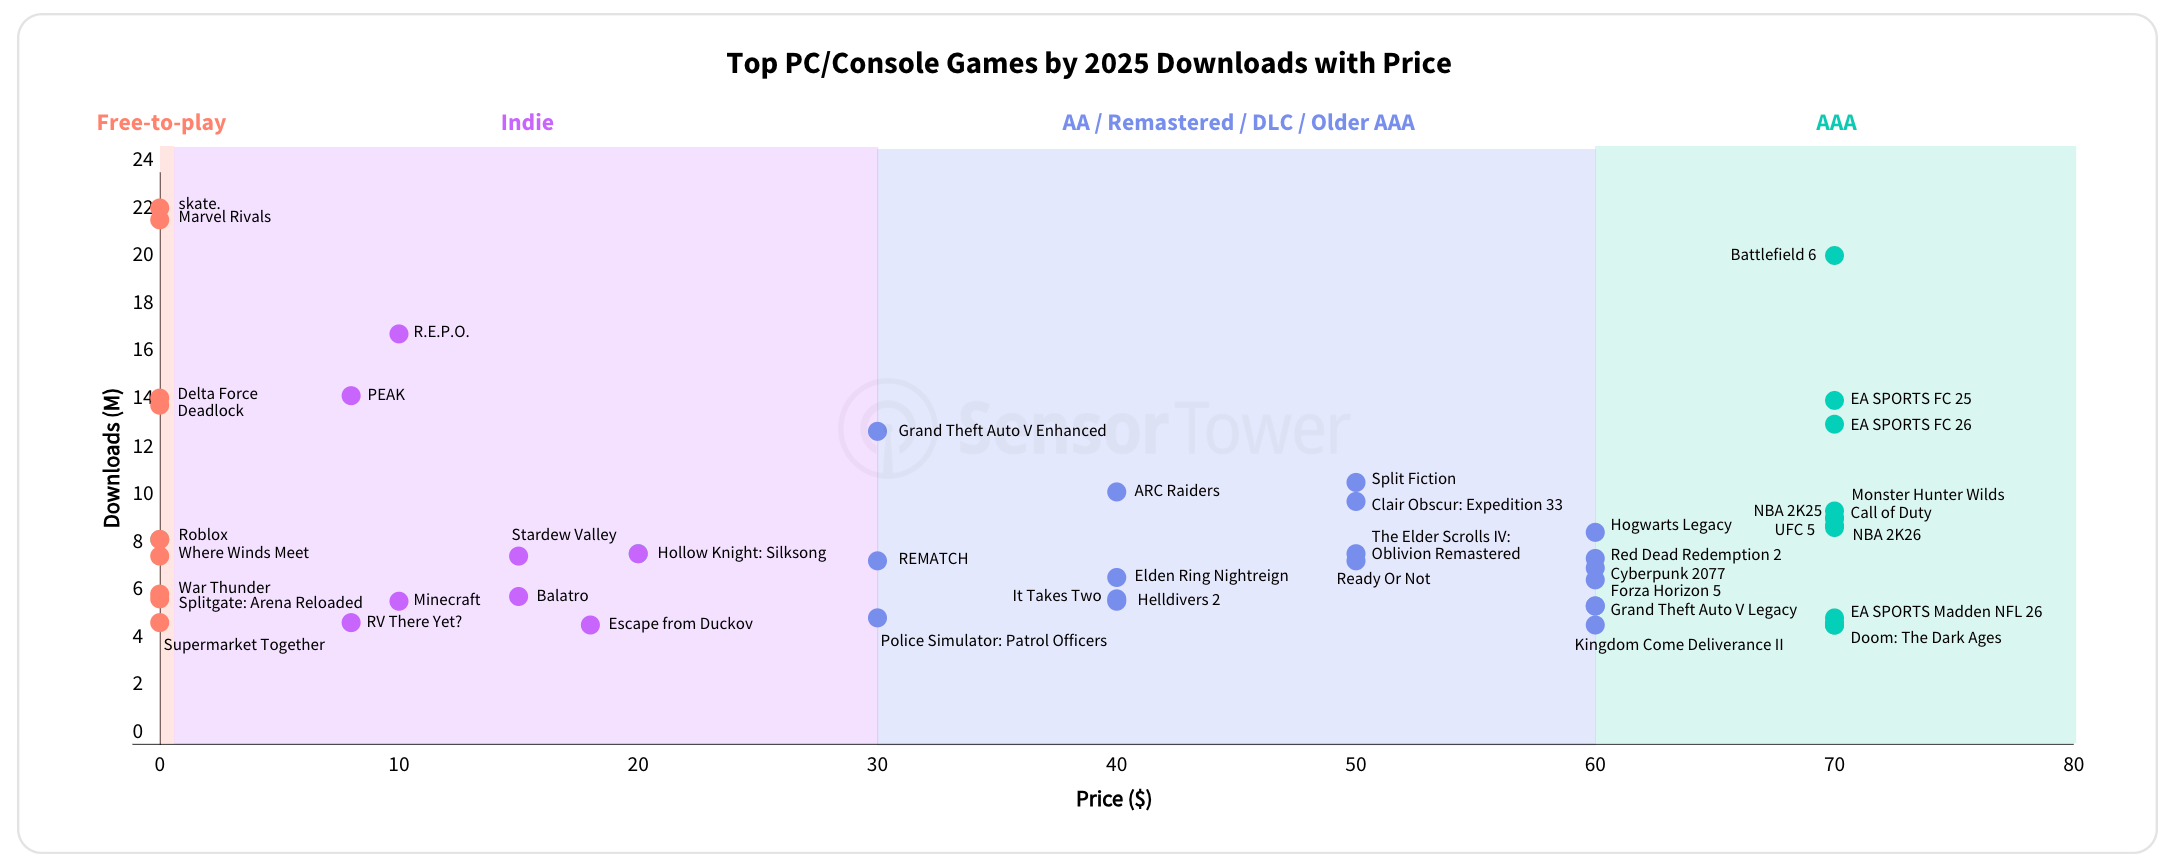
The best-selling game of the year on PC and console was Battlefield 6, followed by R.E.P.O. and PEAK. skate topped downloads among F2P titles, though even that didn’t save the same from recent layoffs.
-
EA had one of its best years in a long time. Battlefield 6, EA Sports FC 25, and EA Sports FC 26 were the top three AAA titles by revenue in 2025. FC 25 and FC 26 combined outsold Battlefield 6.
-
Grand Theft Auto V in 2025 outsold Split Fiction, Clair Obscur: Expedition 33, The Elder Scrolls IV: Oblivion Remastered, and many other major releases. An impressive demonstration of that game’s staying power, especially against the strong AA growth.
-
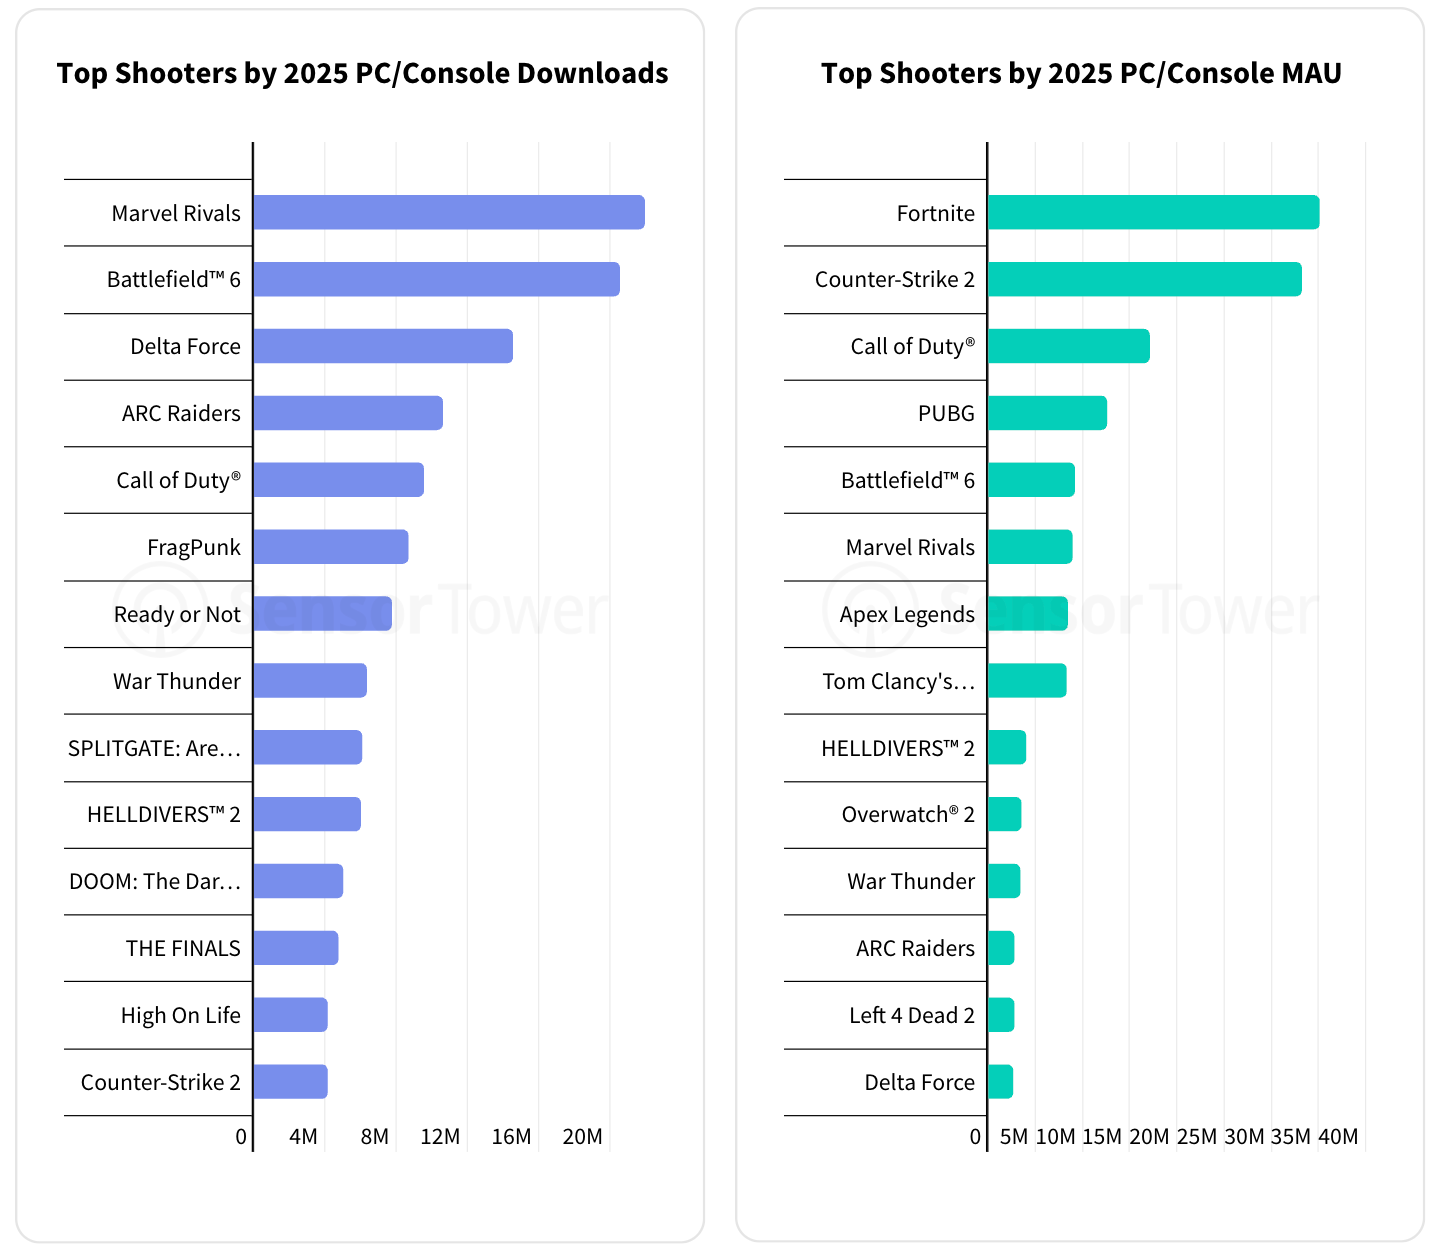
Fortnite remains #1 by MAU among all PC/console titles. Counter-Strike 2 is second, despite being exclusive to Steam.
-
Among new releases, only Battlefield 6 (#9) and Marvel Rivals (#10) cracked the annual top 10 by MAU.
-
Steam shows more variety: PEAK and R.E.P.O. both made the top 10 by MAU for the year.
-
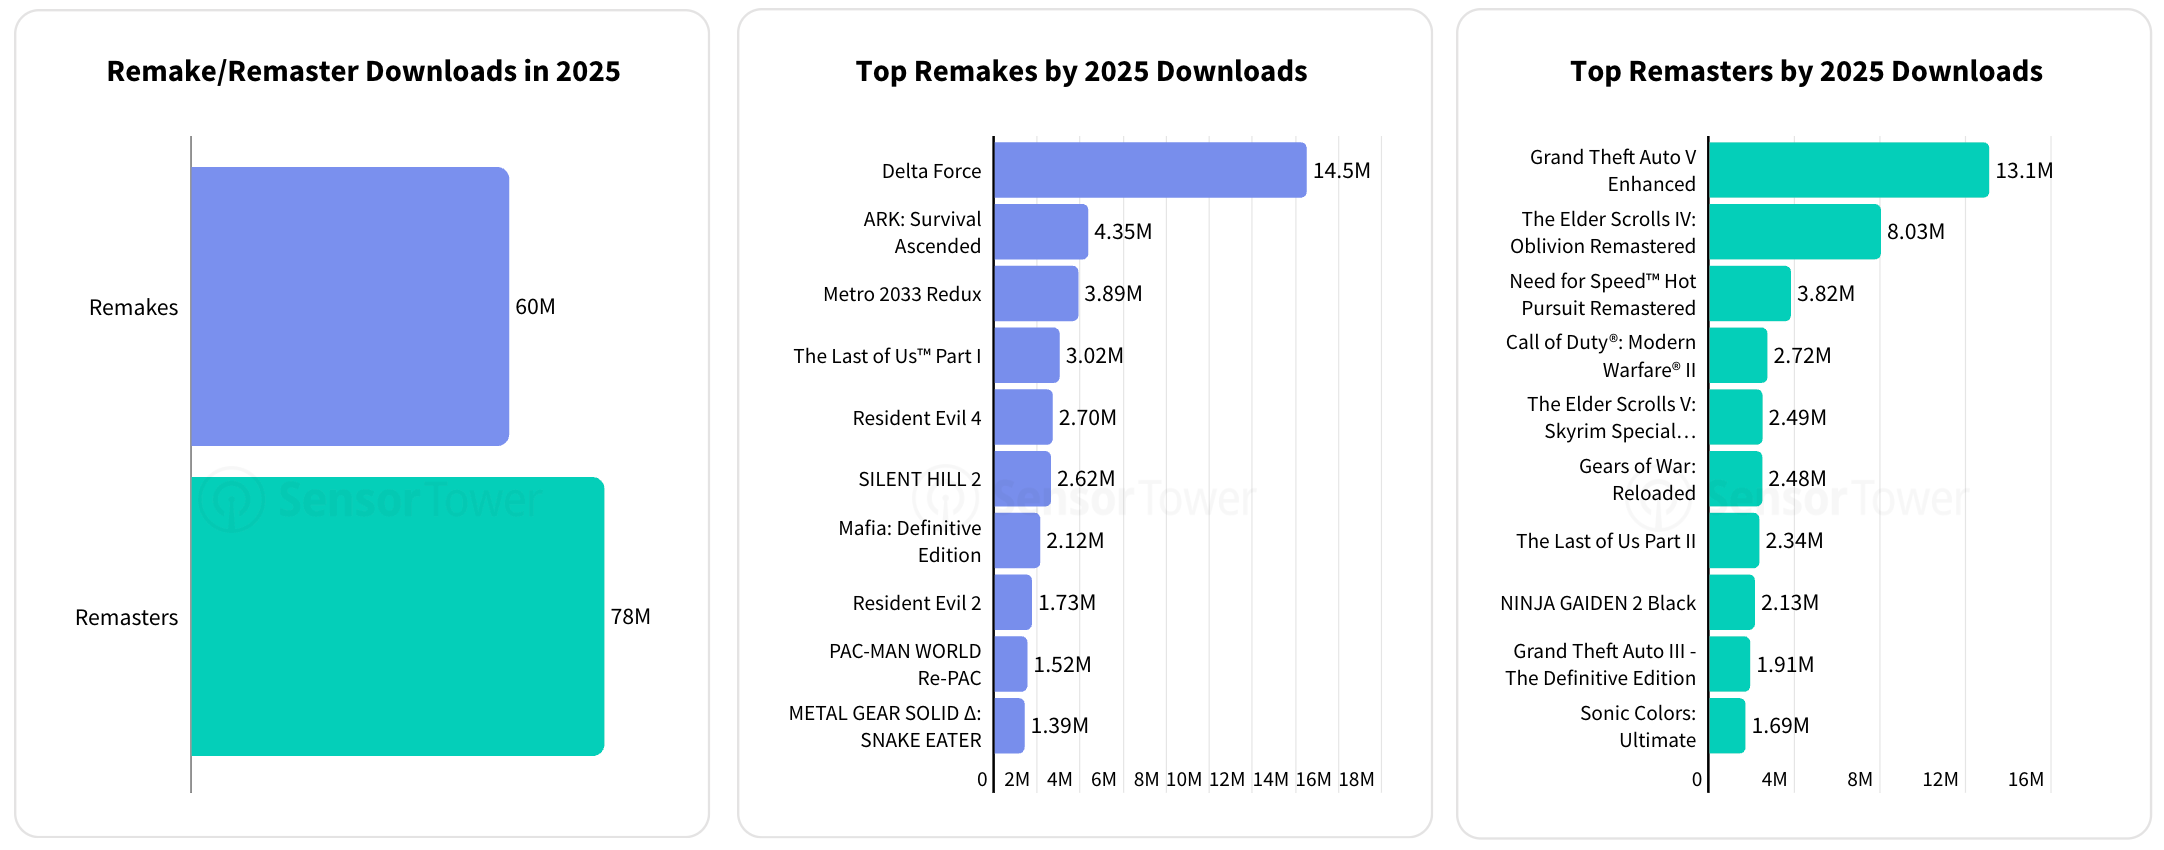
Remakes and remasters were downloaded 138 million times in 2025. Delta Force led by downloads (14.5 million). GTA V Enhanced topped the units chart (13.1 million), followed by Oblivion Remastered (8.03 million) and ARK: Survival Ascended (4.35 million).
-
On Steam wishlists at time of writing: Subnautica 2 led with over 3 million, followed by Resident Evil Requiem (2.83 million), Light No Fire (2.34 million), and Forza Horizon 6 (2.34 million).


-
OKU, a game about a wandering monk, leads by a wide margin in Steam followers (373,000), ahead of both Subnautica 2 (265,000) and Light No Fire (220,000).
-
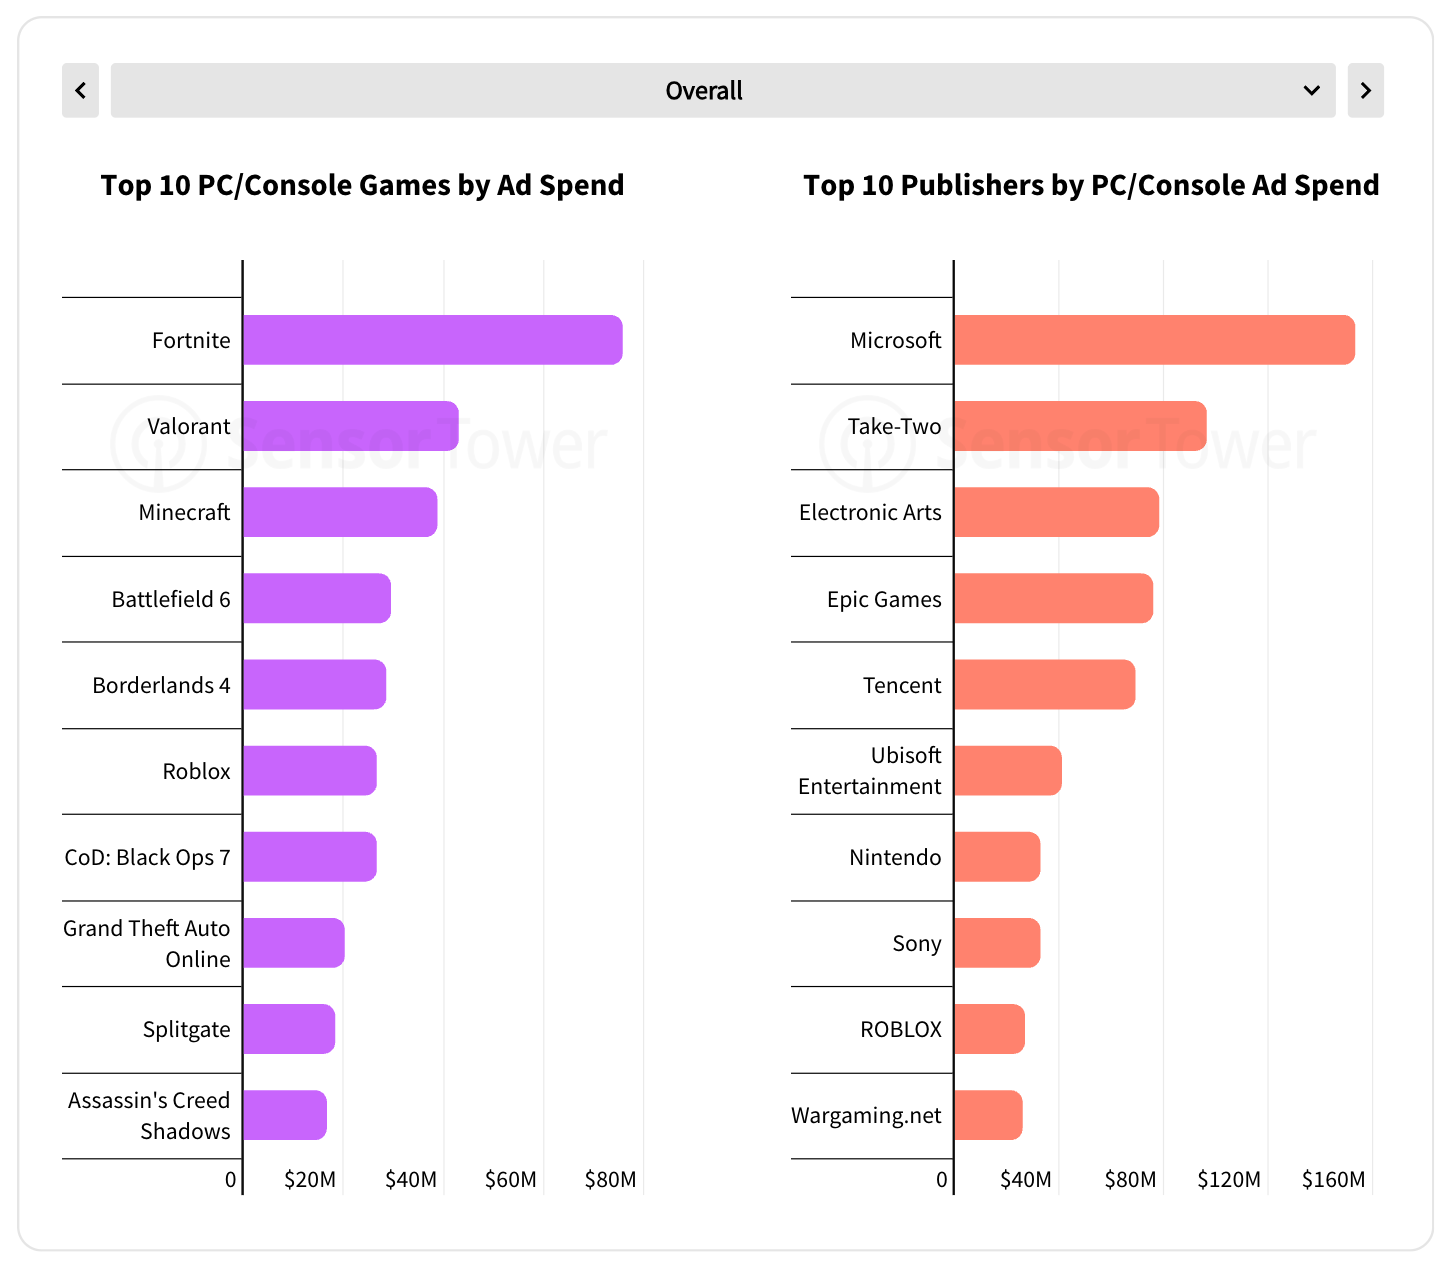
YouTube and social media remain the primary marketing channels for PC/console games in 2025, with the marketing mix shifting depending on genre.
-
Among companies, Microsoft, Take-Two, and Electronic Arts are leading.
Shooters on PC/Console
-
NetEase entered the market with Marvel Rivals, Tencent with Delta Force. ARC Raiders became a hit: 4th in shooter downloads, 12th in MAU. Battlefield 6 launched very successfully. But despite all of this, the top 3 by MAU remain unchanged: Fortnite, Counter-Strike 2, and Call of Duty.
-
For most shooters, the US and Europe are the primary markets. Notable outliers are Counter-Strike 2 (a large share in Europe and Asia) and Delta Force (a similar pattern).


❗️Country-level metrics here exclude Xbox, so some of the North American audience (where the console has the strongest presence) may be missing from the data.
-
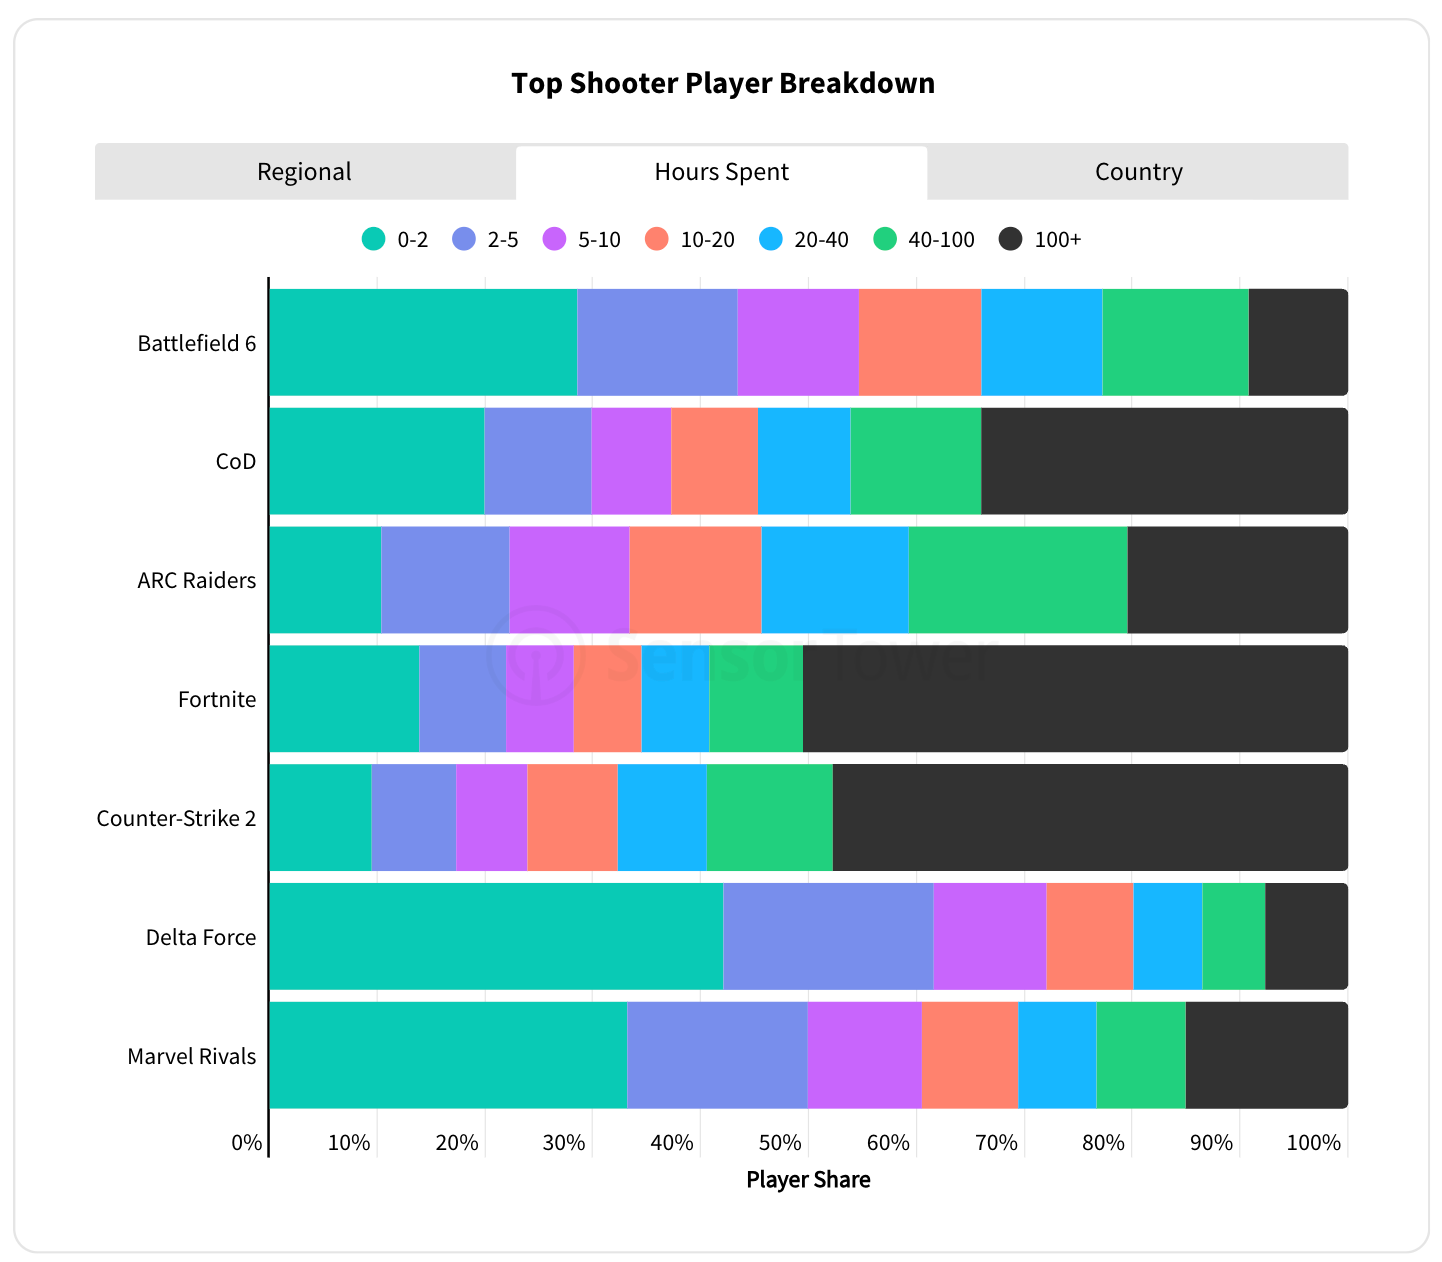
ARC Raiders significantly outpaced Battlefield 6, Delta Force, and Marvel Rivals in user engagement: around 20% of players have already logged 100+ hours, despite launching in late 2025. Comparable figures are only seen in long-running live service titles like Call of Duty, Fortnite, and Counter-Strike.
-
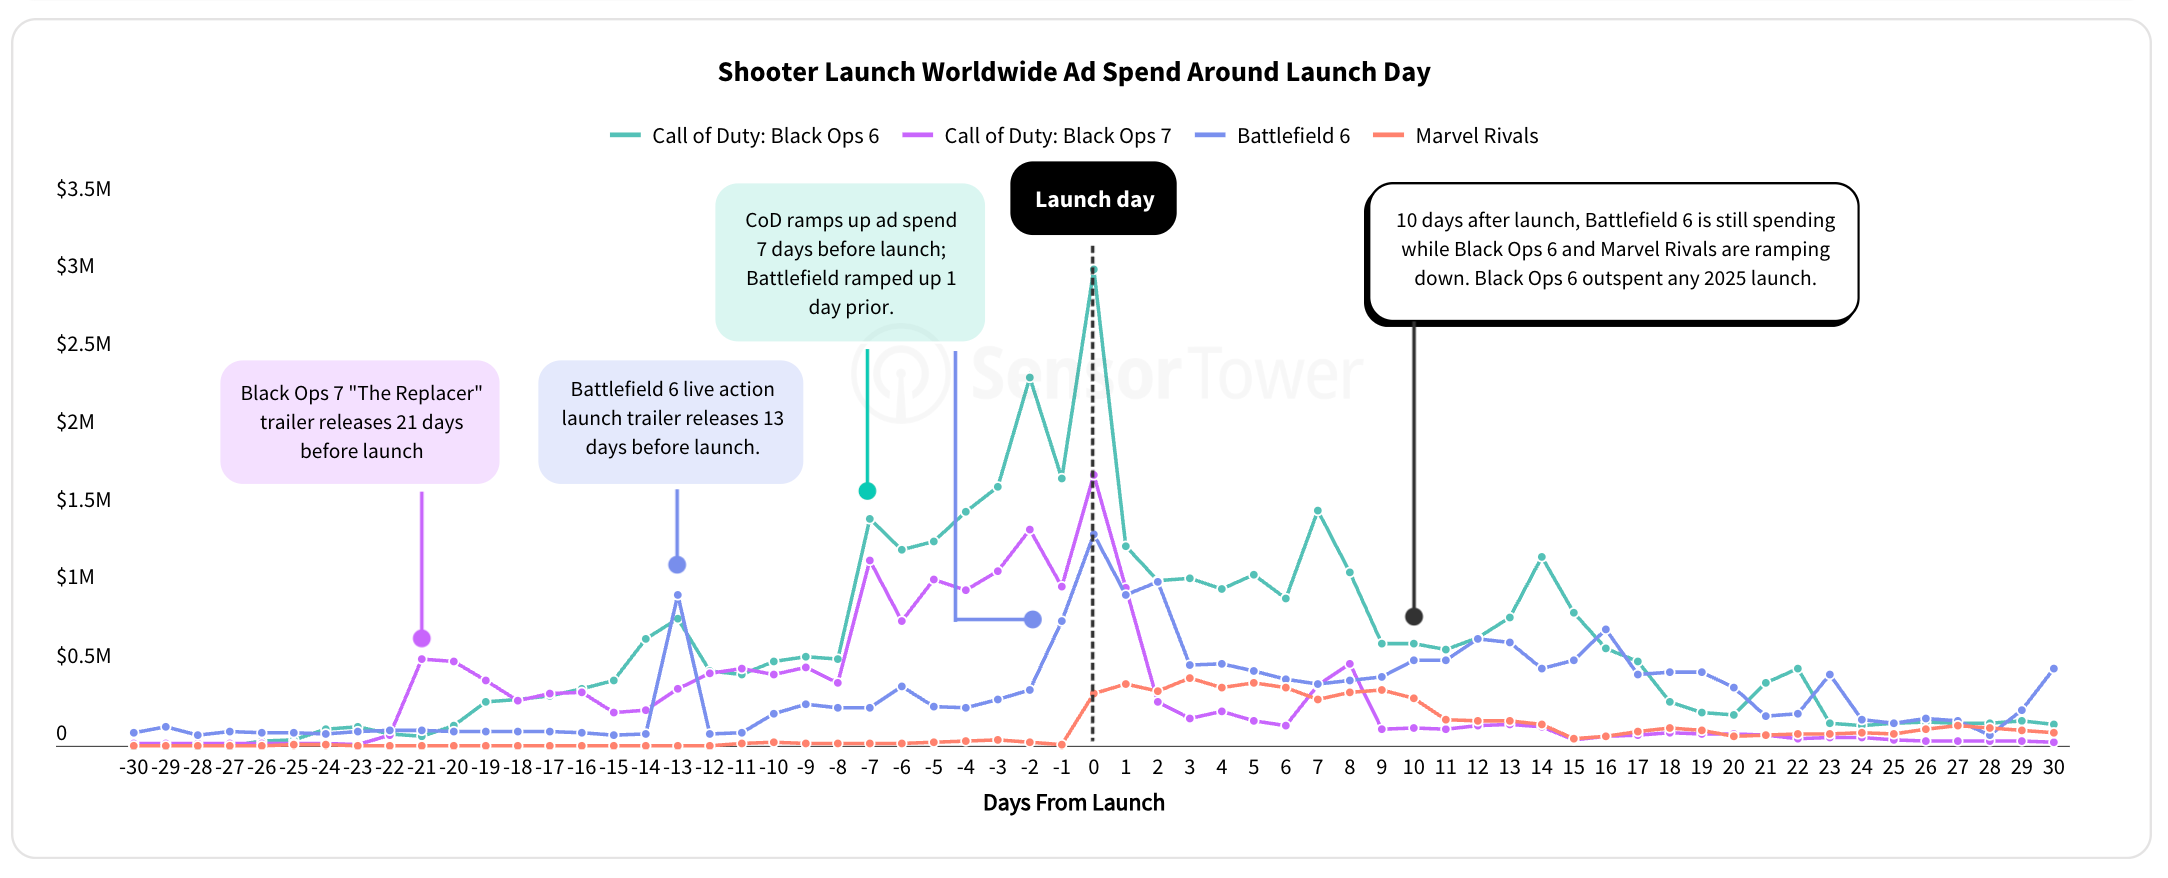
The advertising strategies of Battlefield 6 and CoD were fundamentally different. CoD ramped up ads 7+ days before launch and pulled back spend quickly afterward. Battlefield 6 launched a major marketing push just 1 day before release and maintained high spend for over 10 days post-launch.
-
Marvel Rivals’ ad campaigns started on launch day and began tapering off around 9 days later.
-
Call of Duty: Black Ops 6 in 2024 spent more on advertising than any title in 2025.
-
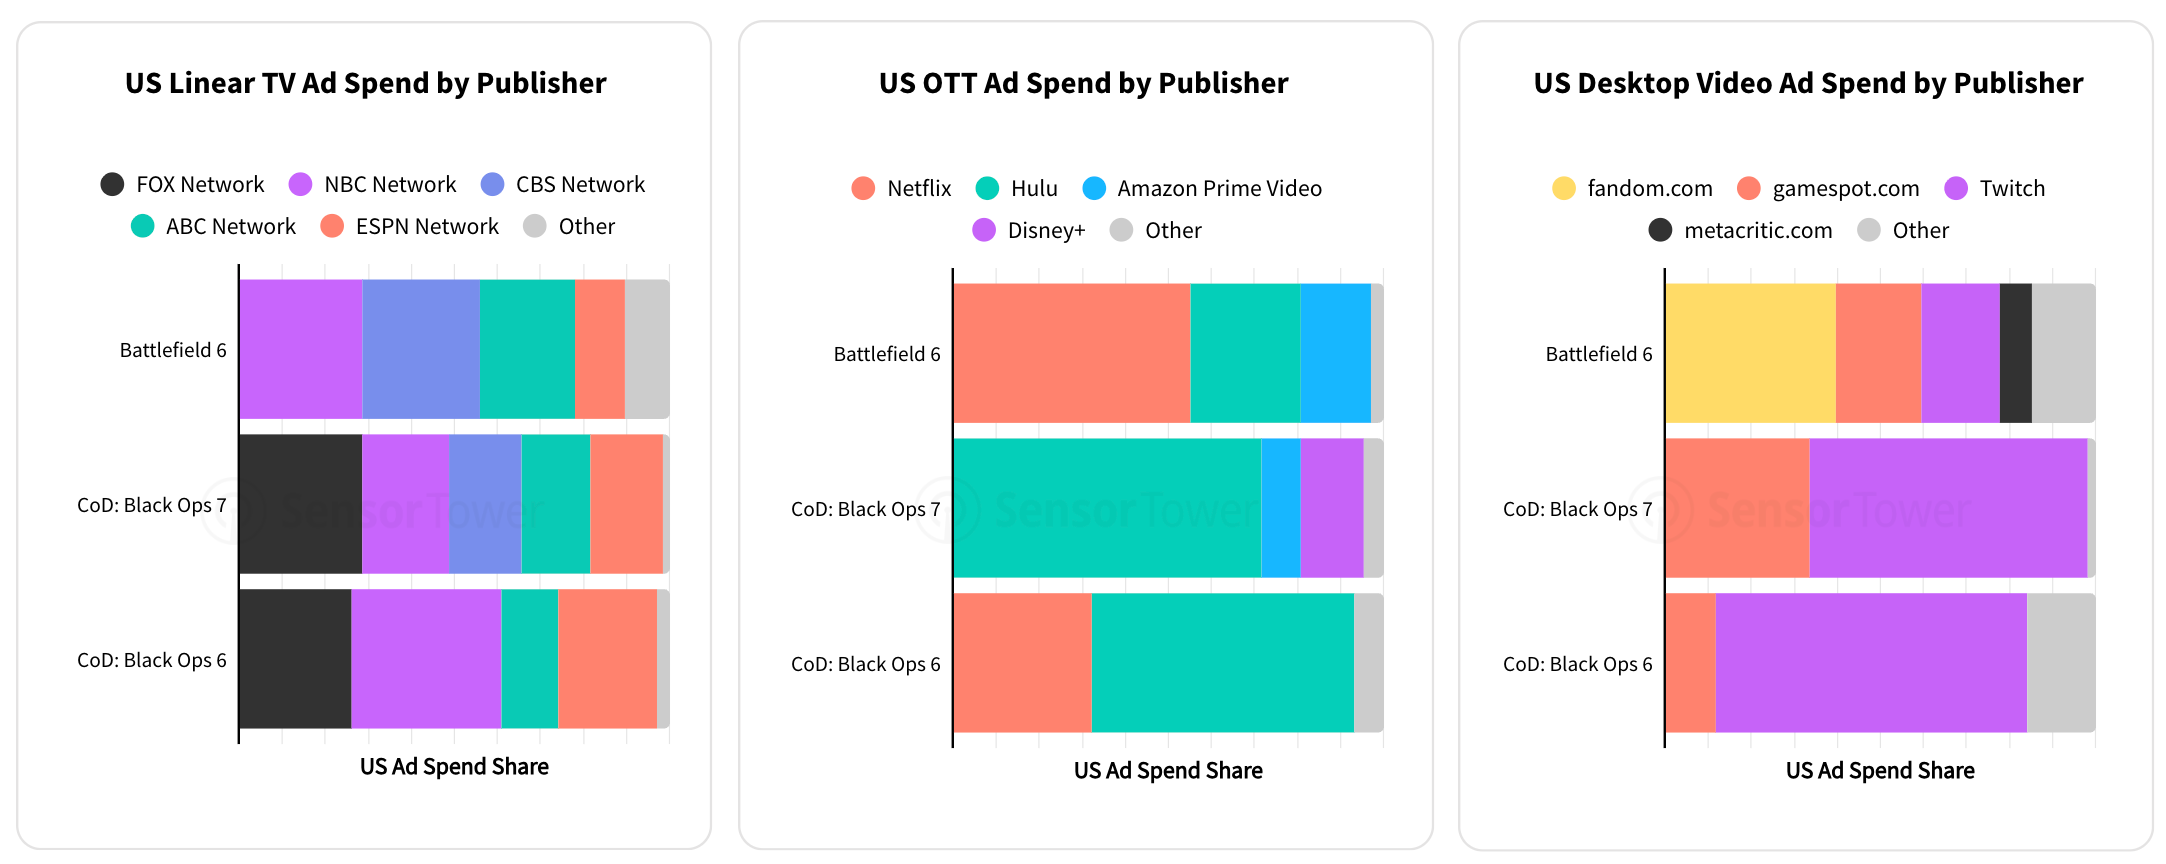
Battlefield 6 used an unusual channel mix for a AAA title: more focus on Facebook, Reddit, Linear TV, and OTT; less on YouTube, TikTok, and Instagram. Most likely an attempt to reach as much of an older audience as possible.


-
Among OTT channels, Battlefield 6 ran placements on Netflix. In Desktop Video, it leaned heavily on Fandom.com, while most of Call of Duty: Black Ops 7’s spend went to Twitch.